Control is an illusion.
Levels are not.
Where the positions stand — after the latest update.
The weather system — after NFP.
The four-leg model has become a five-leg model: the long end (20Y/30Y) gets its own slot, and the liquidity side (formerly "Fed B/S") is now called fiscal dominance, covering RMPs, buybacks and the global frame. After the NFP beat, the macro foundation rests primarily on Leg 5 and the DXY divergence — narrower than two weeks ago, but not gone.
The decision stands (Sep 3): a liquidity/risk exit, not a thesis exit — the metals/miners thesis stays intact. Roughly 90% of capital sits in correlated long calls of one sector; after the synchronous breakout and the NEM strike touch, the first profit-taking phase is due. End state per ticker: one runner with a stop at the strike, the rest realised.
How, where, when — open. The trigger is the monthly structure, not the calendar: close the September IB first (Fri Sep 11), then watch the balance, then use the October monthly IBH as the trim trigger. Levels decide, not the sequence. Time stop for reassessment: FOMC Sep 16. The only exception to the October timer: FCX NOV26 (expiry Nov 20, breakevens 82.54/86.36) — decision this week, ahead of PPI/CPI.
| Instrument | Continuation level | Position exit trigger (weekly close) | Status |
|---|---|---|---|
| Gold | 4,540 — broken Sep 4 | < 4,283 | tested 4,283, bounce > 4,400 — no trigger |
| Silver | 66.81 | < 66.13 | holding |
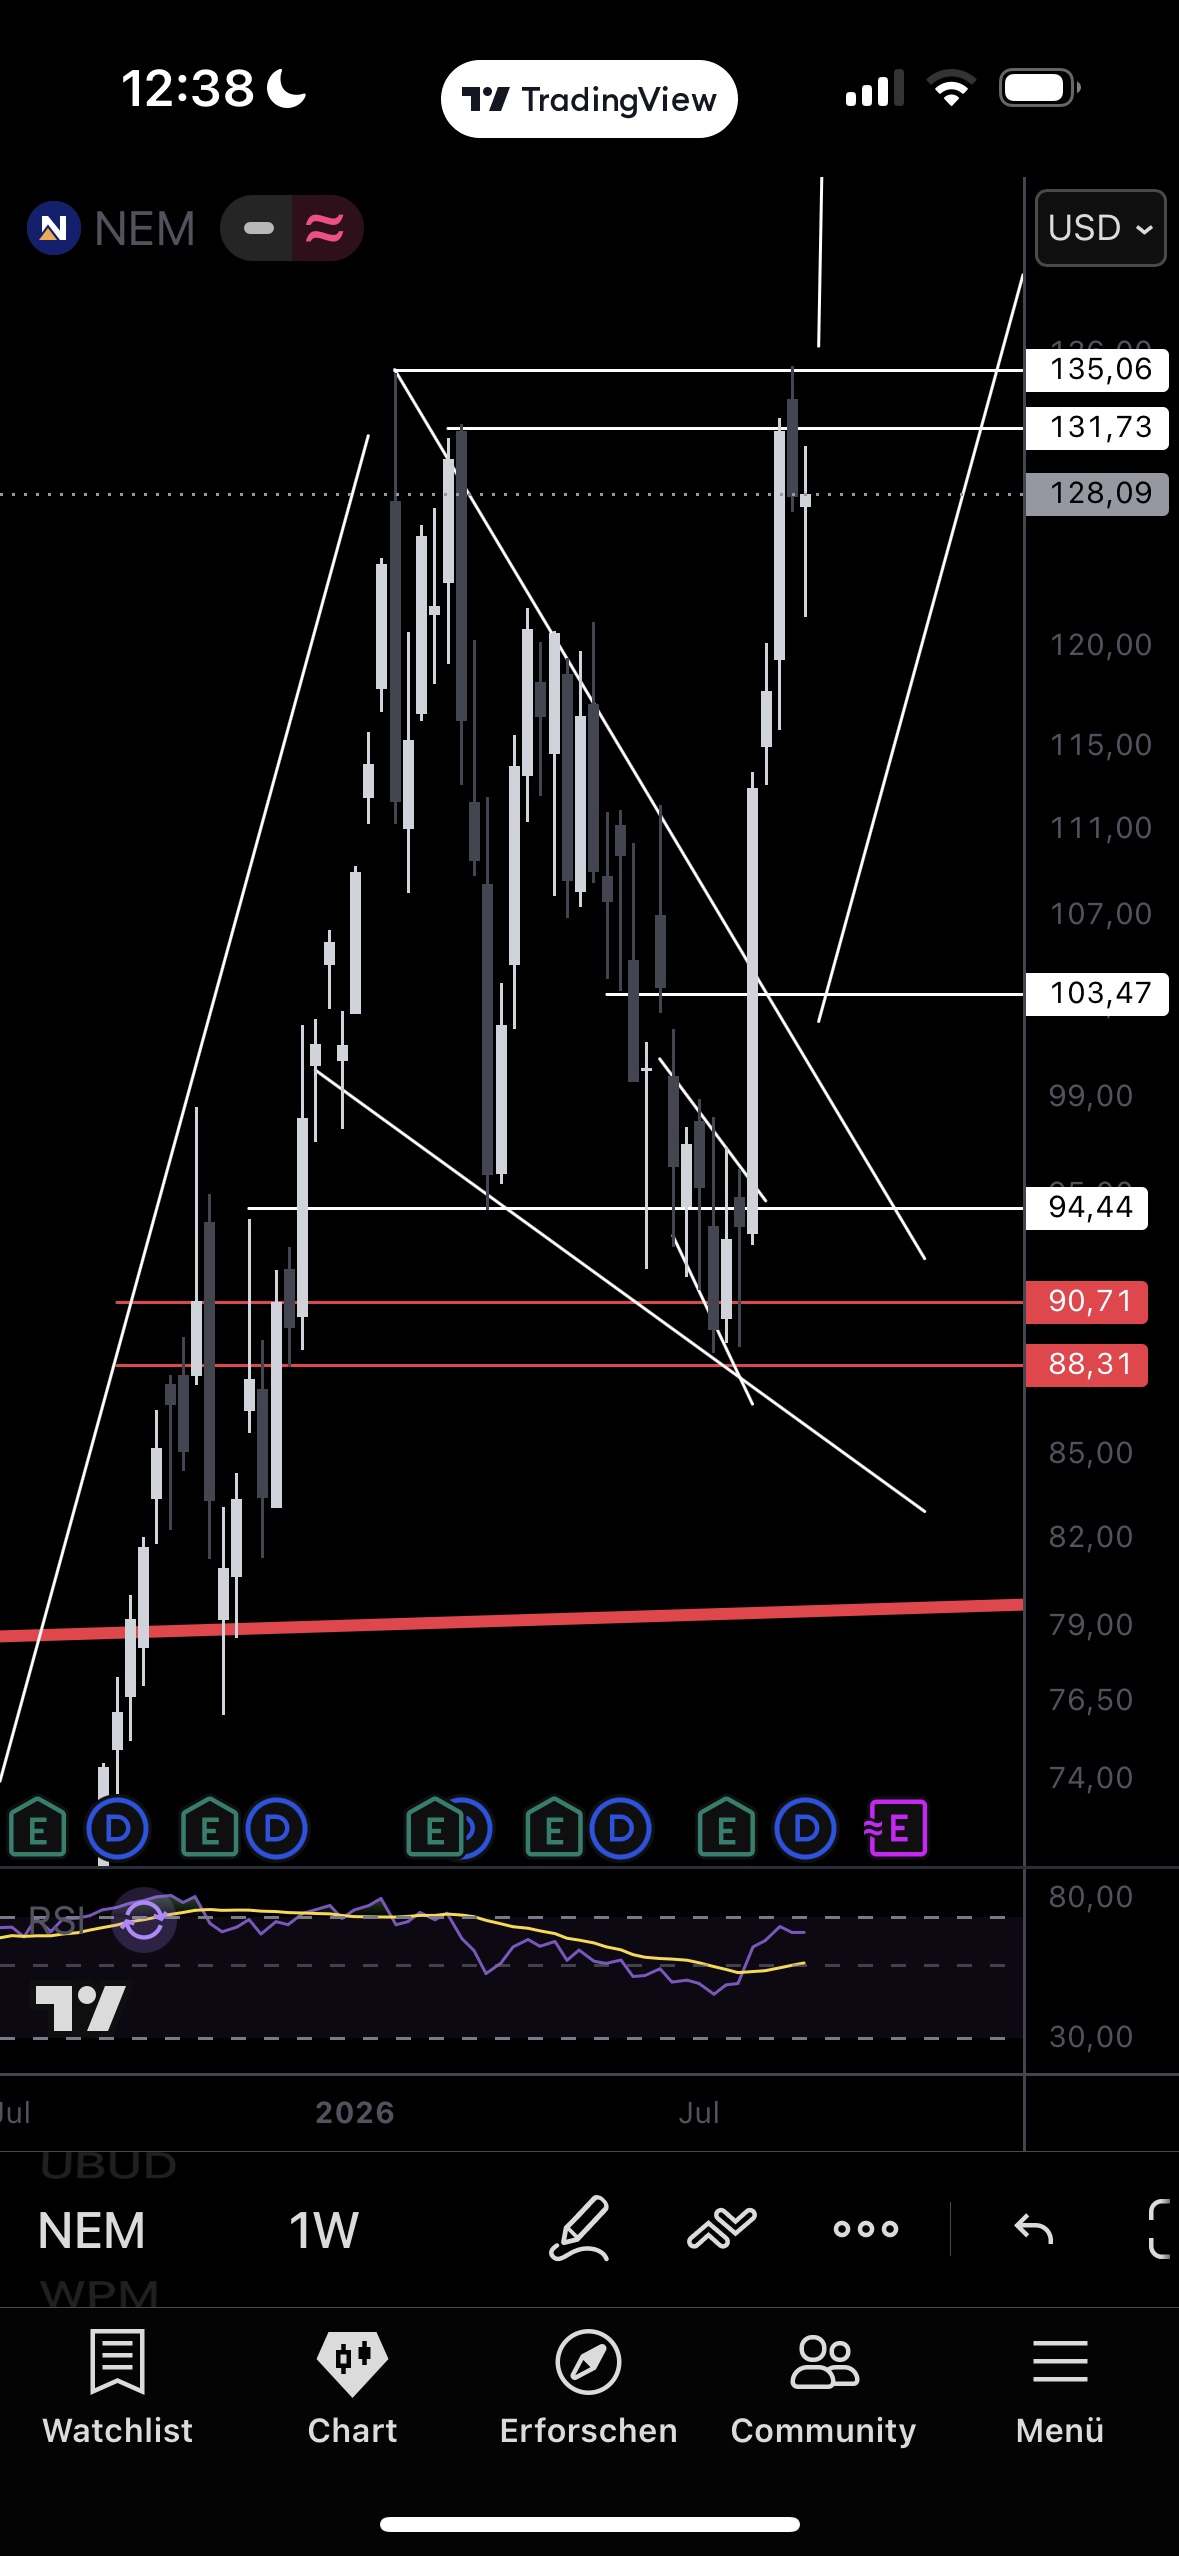
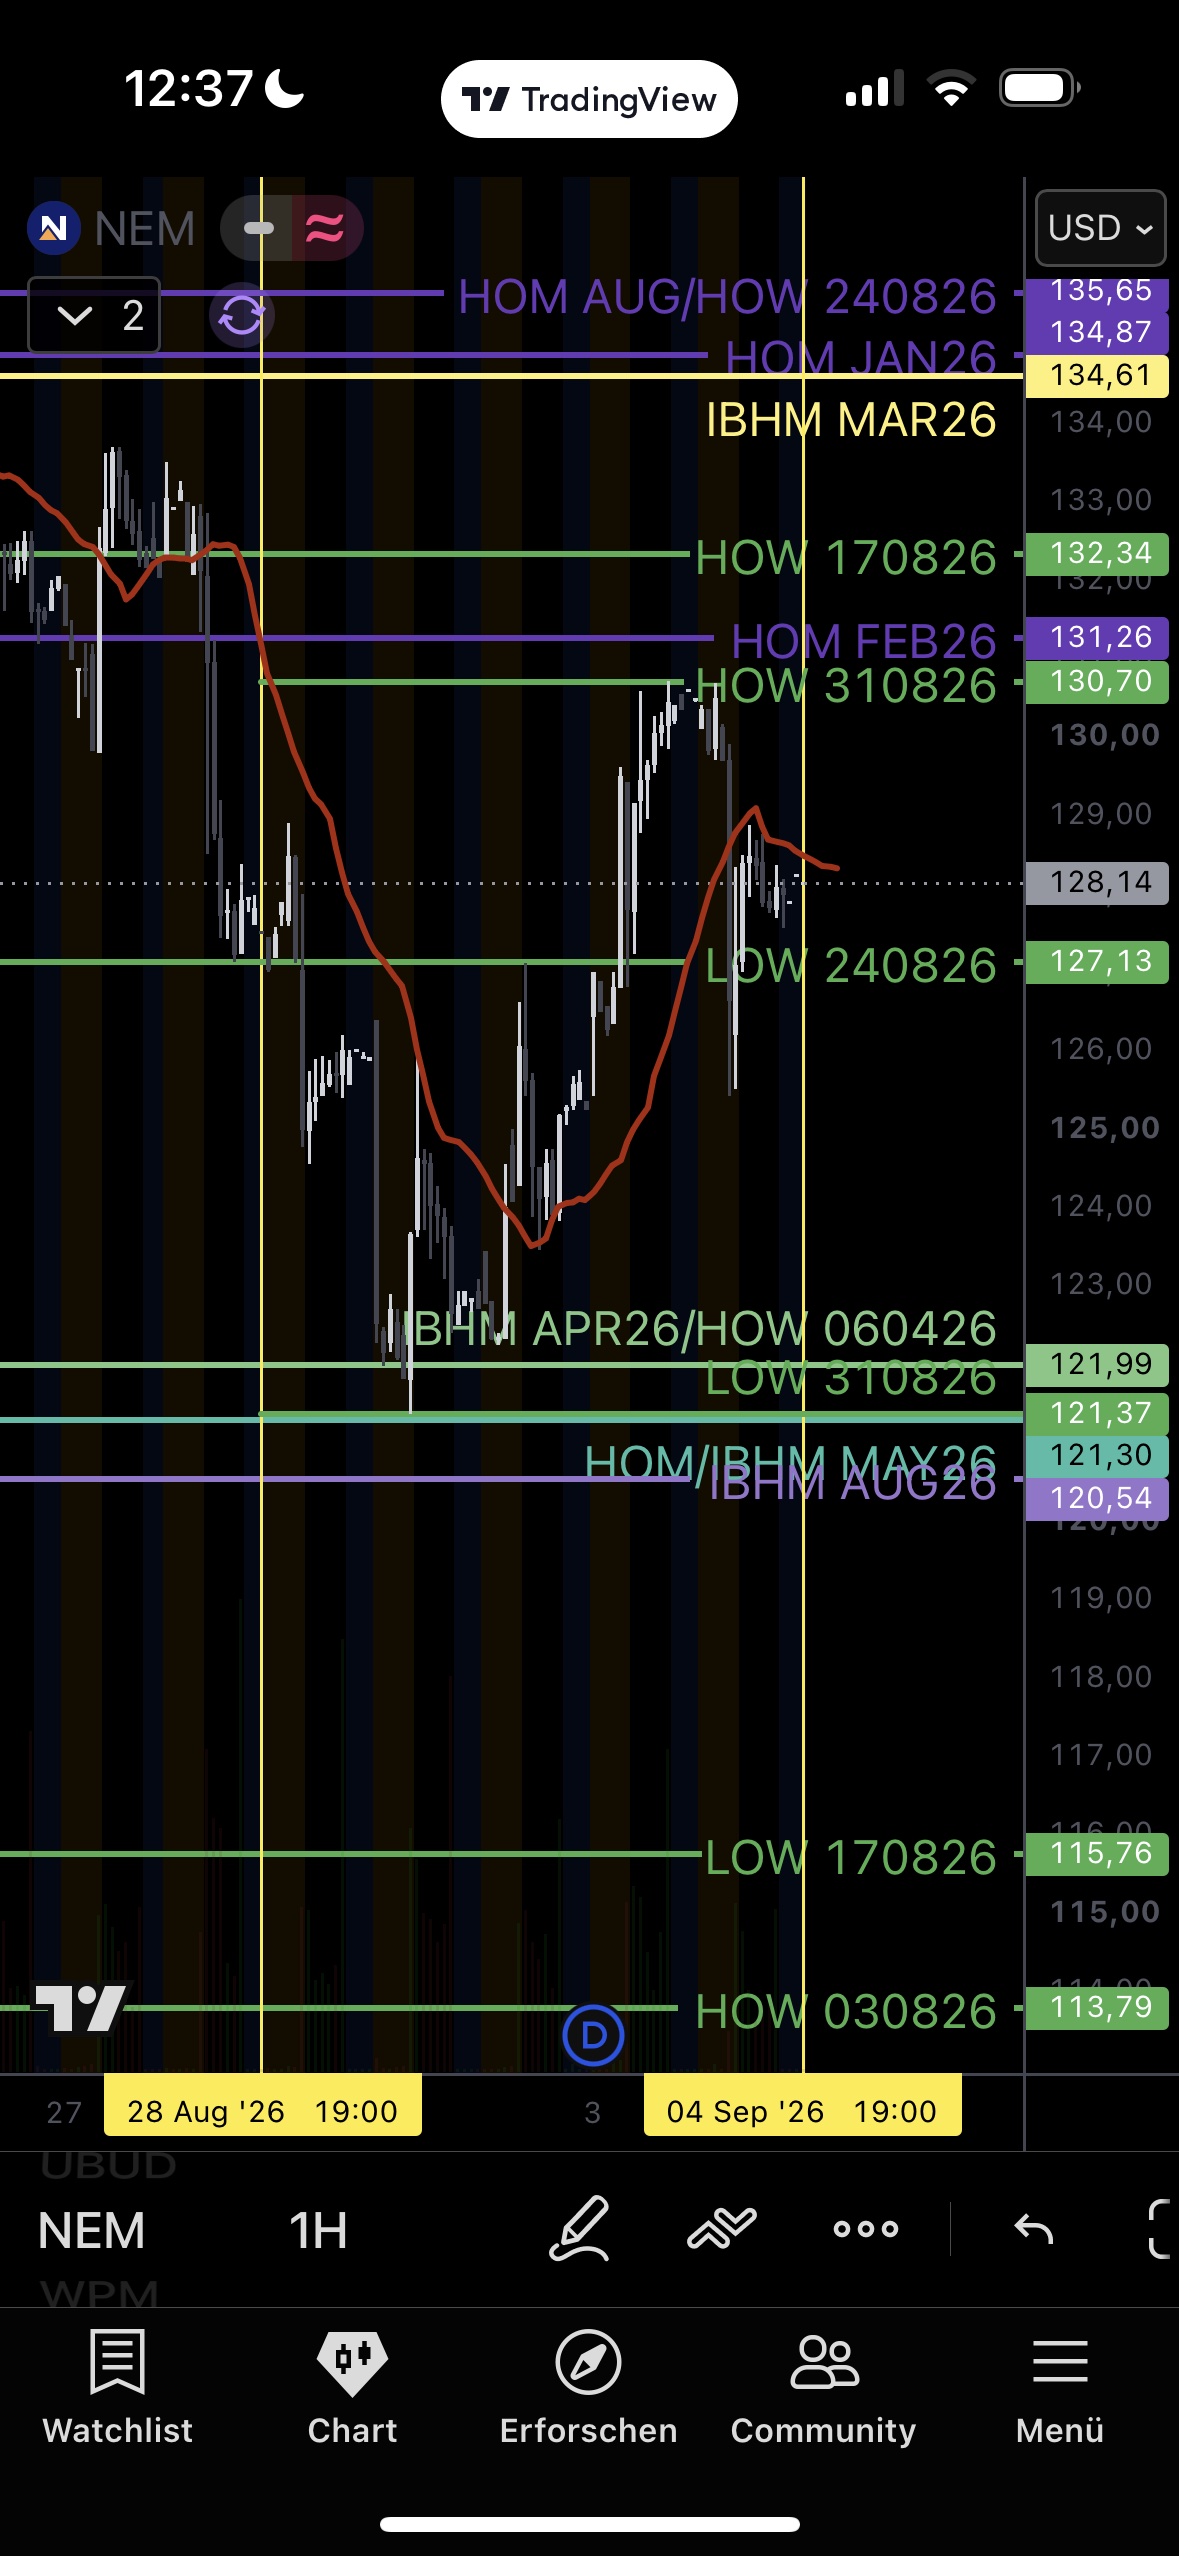
| NEM | 130.70 | < 127.13 | tested intraday, not triggered |
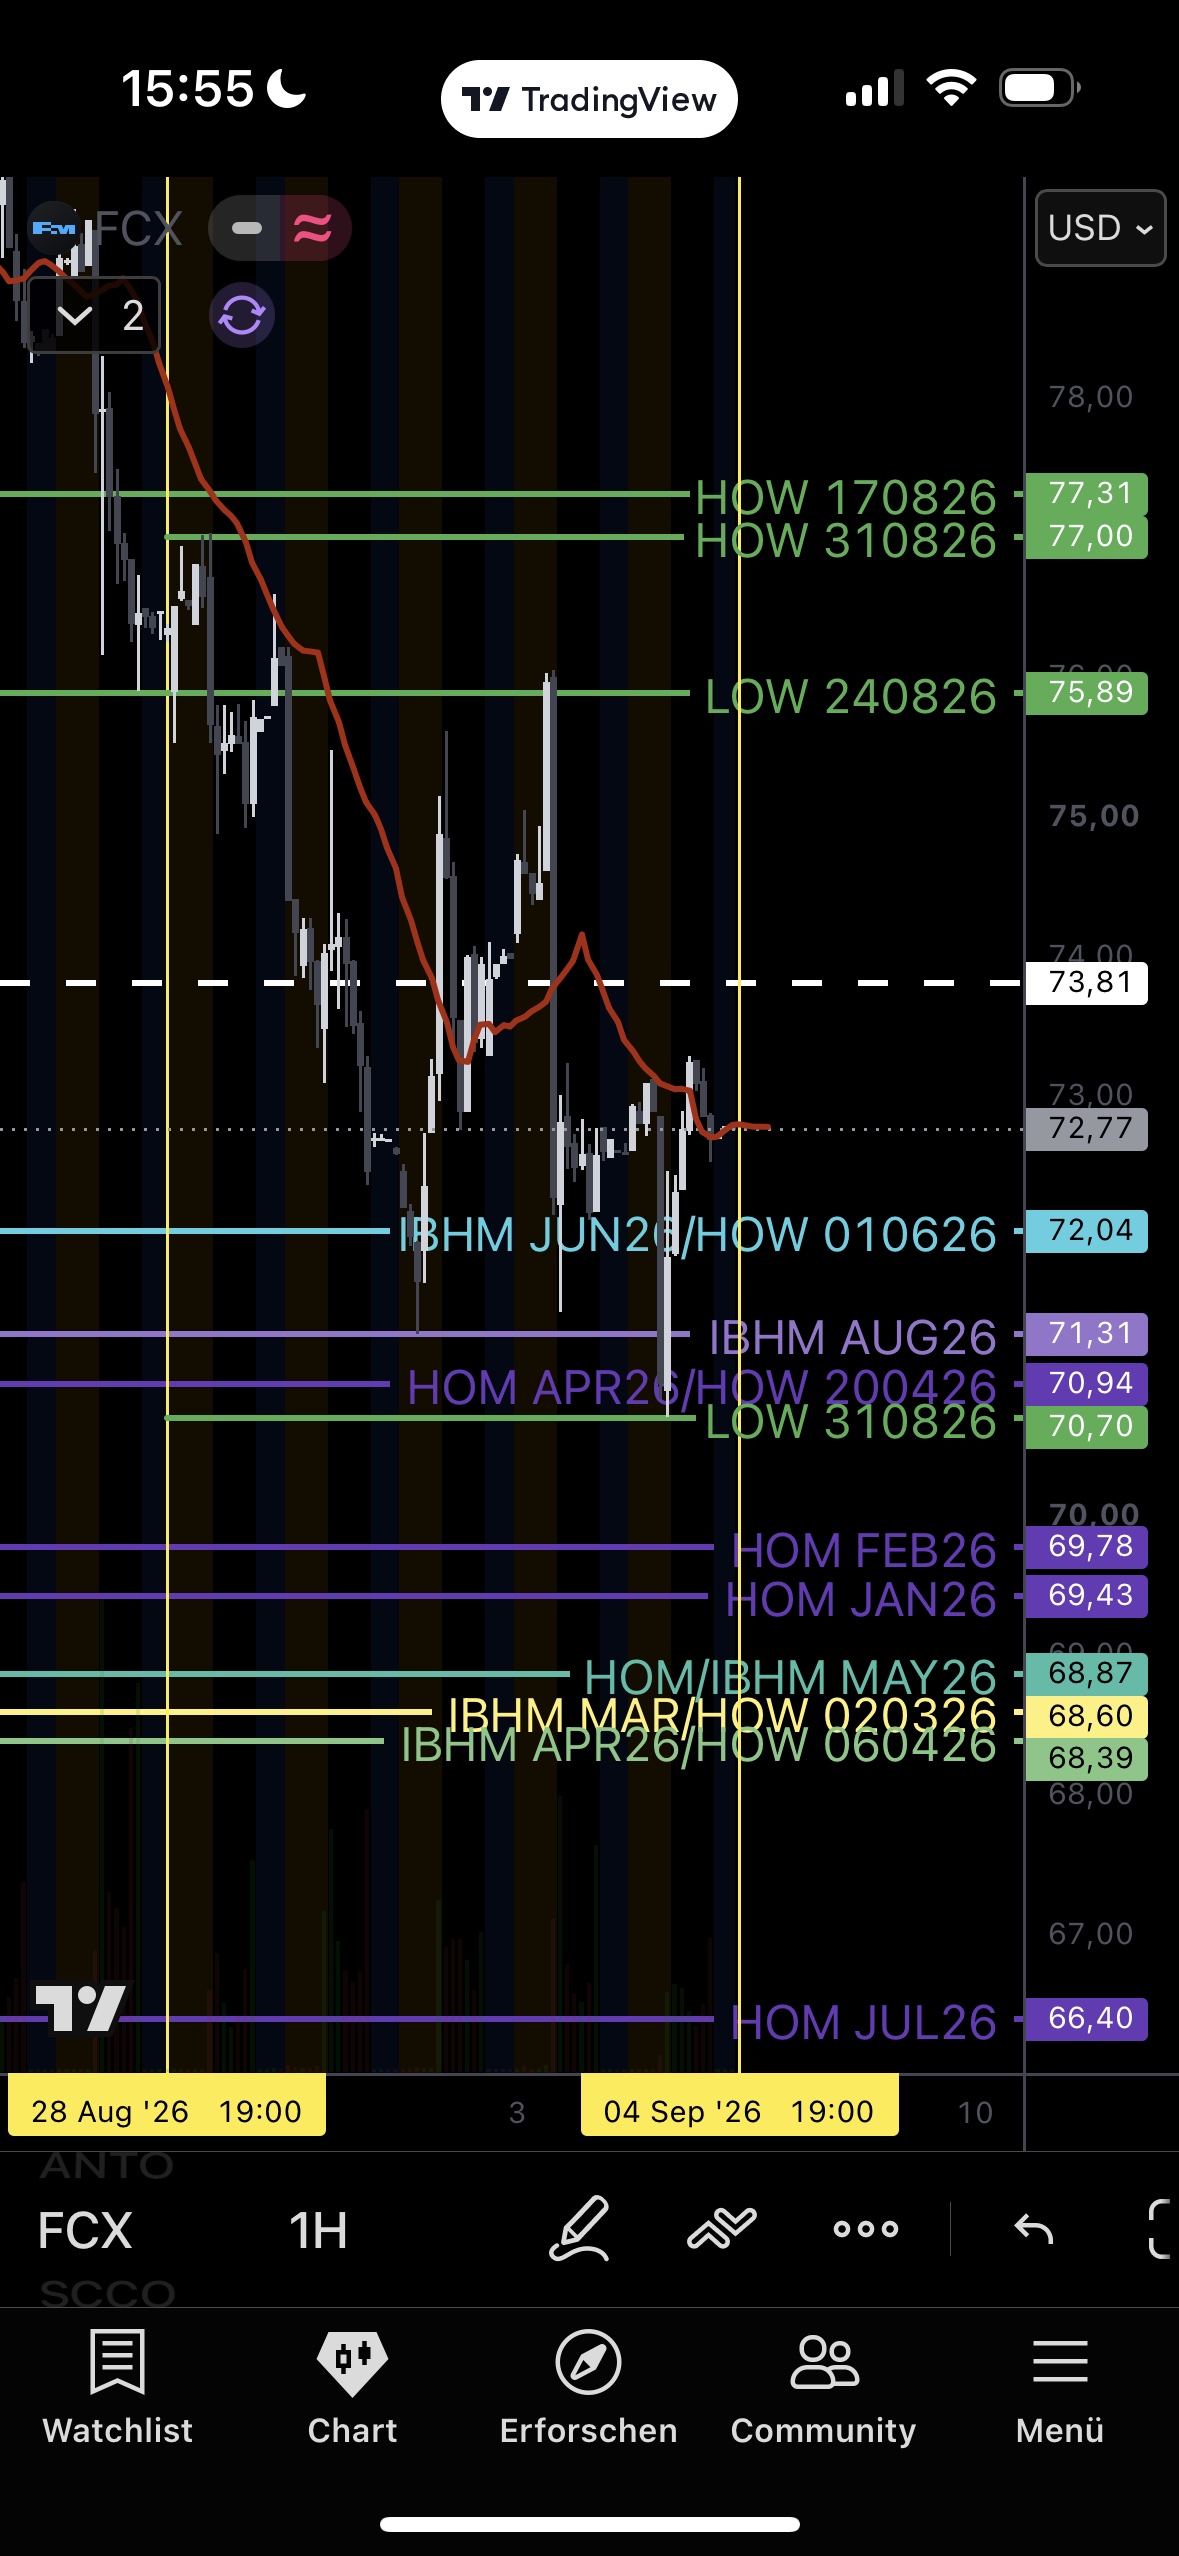
| FCX | 75.89 — broken | < 73.81 | triggered |
| HL | 19.88 | < 17.98 | holding |
Two level types that must not be confused: a continuation level has to hold for the direct blow-off path to stay open — its break only removes the continuation scenario, not the position. Trimming happens at the position exit trigger on the structural lower edge.
NFP invalidates Leg 3, the dollar stays weak, the yield/dollar correlation breaks, FCX trips the trigger — the full status for this week.
Four legs, nine positions, the honest ledger — breakout, pump and first breather.
September 2026
WEEK 14 CURRENT▸
One data print flips a leg — not the thesis.
The US jobs report of September 4 came in far stronger than expected: +162,000 jobs against +56,000 expected, plus a cumulative +55,000 upward revision for June and July. The July miss — until now the central argument for the "growth scare" thesis and the expected yield rollover — was revised up after the fact. The result: yields higher across the whole curve, US10Y with a new high at 4.816% — the August invalidation mark (4.746%) was not touched but clearly broken. Leg 3 is formally invalidated, Leg 2 shows acceleration instead of rollover.
The crux, though, is not the print but what did not happen: the dollar stays weak. DXY 99.16, still below the 100.62–101.98 cluster — despite yields at multi-year highs. The old reflex chain "rates up → dollar up → metals down" no longer holds, and Bessent does not want that correlation anyway. That decoupling is the thesis that keeps running: Leg 5 (fiscal dominance) plus the DXY divergence carry the metals/miners case — narrower than two weeks ago, but intact. What flipped is the rate-driven tailwind, not the dollar channel.
The metals reacted differently: gold broke the 4,540 continuation level, tested the 4,283 cluster and is back above 4,400 — no exit trigger, but the direct blow-off path is closed for now. Silver holds robustly in a tight range; copper spiked through the 6.865 weekly mark to ~7.0 and was rejected immediately — the first blow-off touch in the complex, sold straight away. Among the positions: eight of nine are consolidating without a trigger. FCX is the first ticker to trip its position exit trigger (weekly close below 73.81).
And the week's central decision isn't in the charts at all: the exit plan "Risk reduction autumn 2026" was made on Sep 3 — liquidity, capital preservation, concentration risk, a calmer winter. Not as a reaction to a correction forecast, but as a deliberate decision after a strong run. How and where, the levels decide.
No rollover — acceleration.
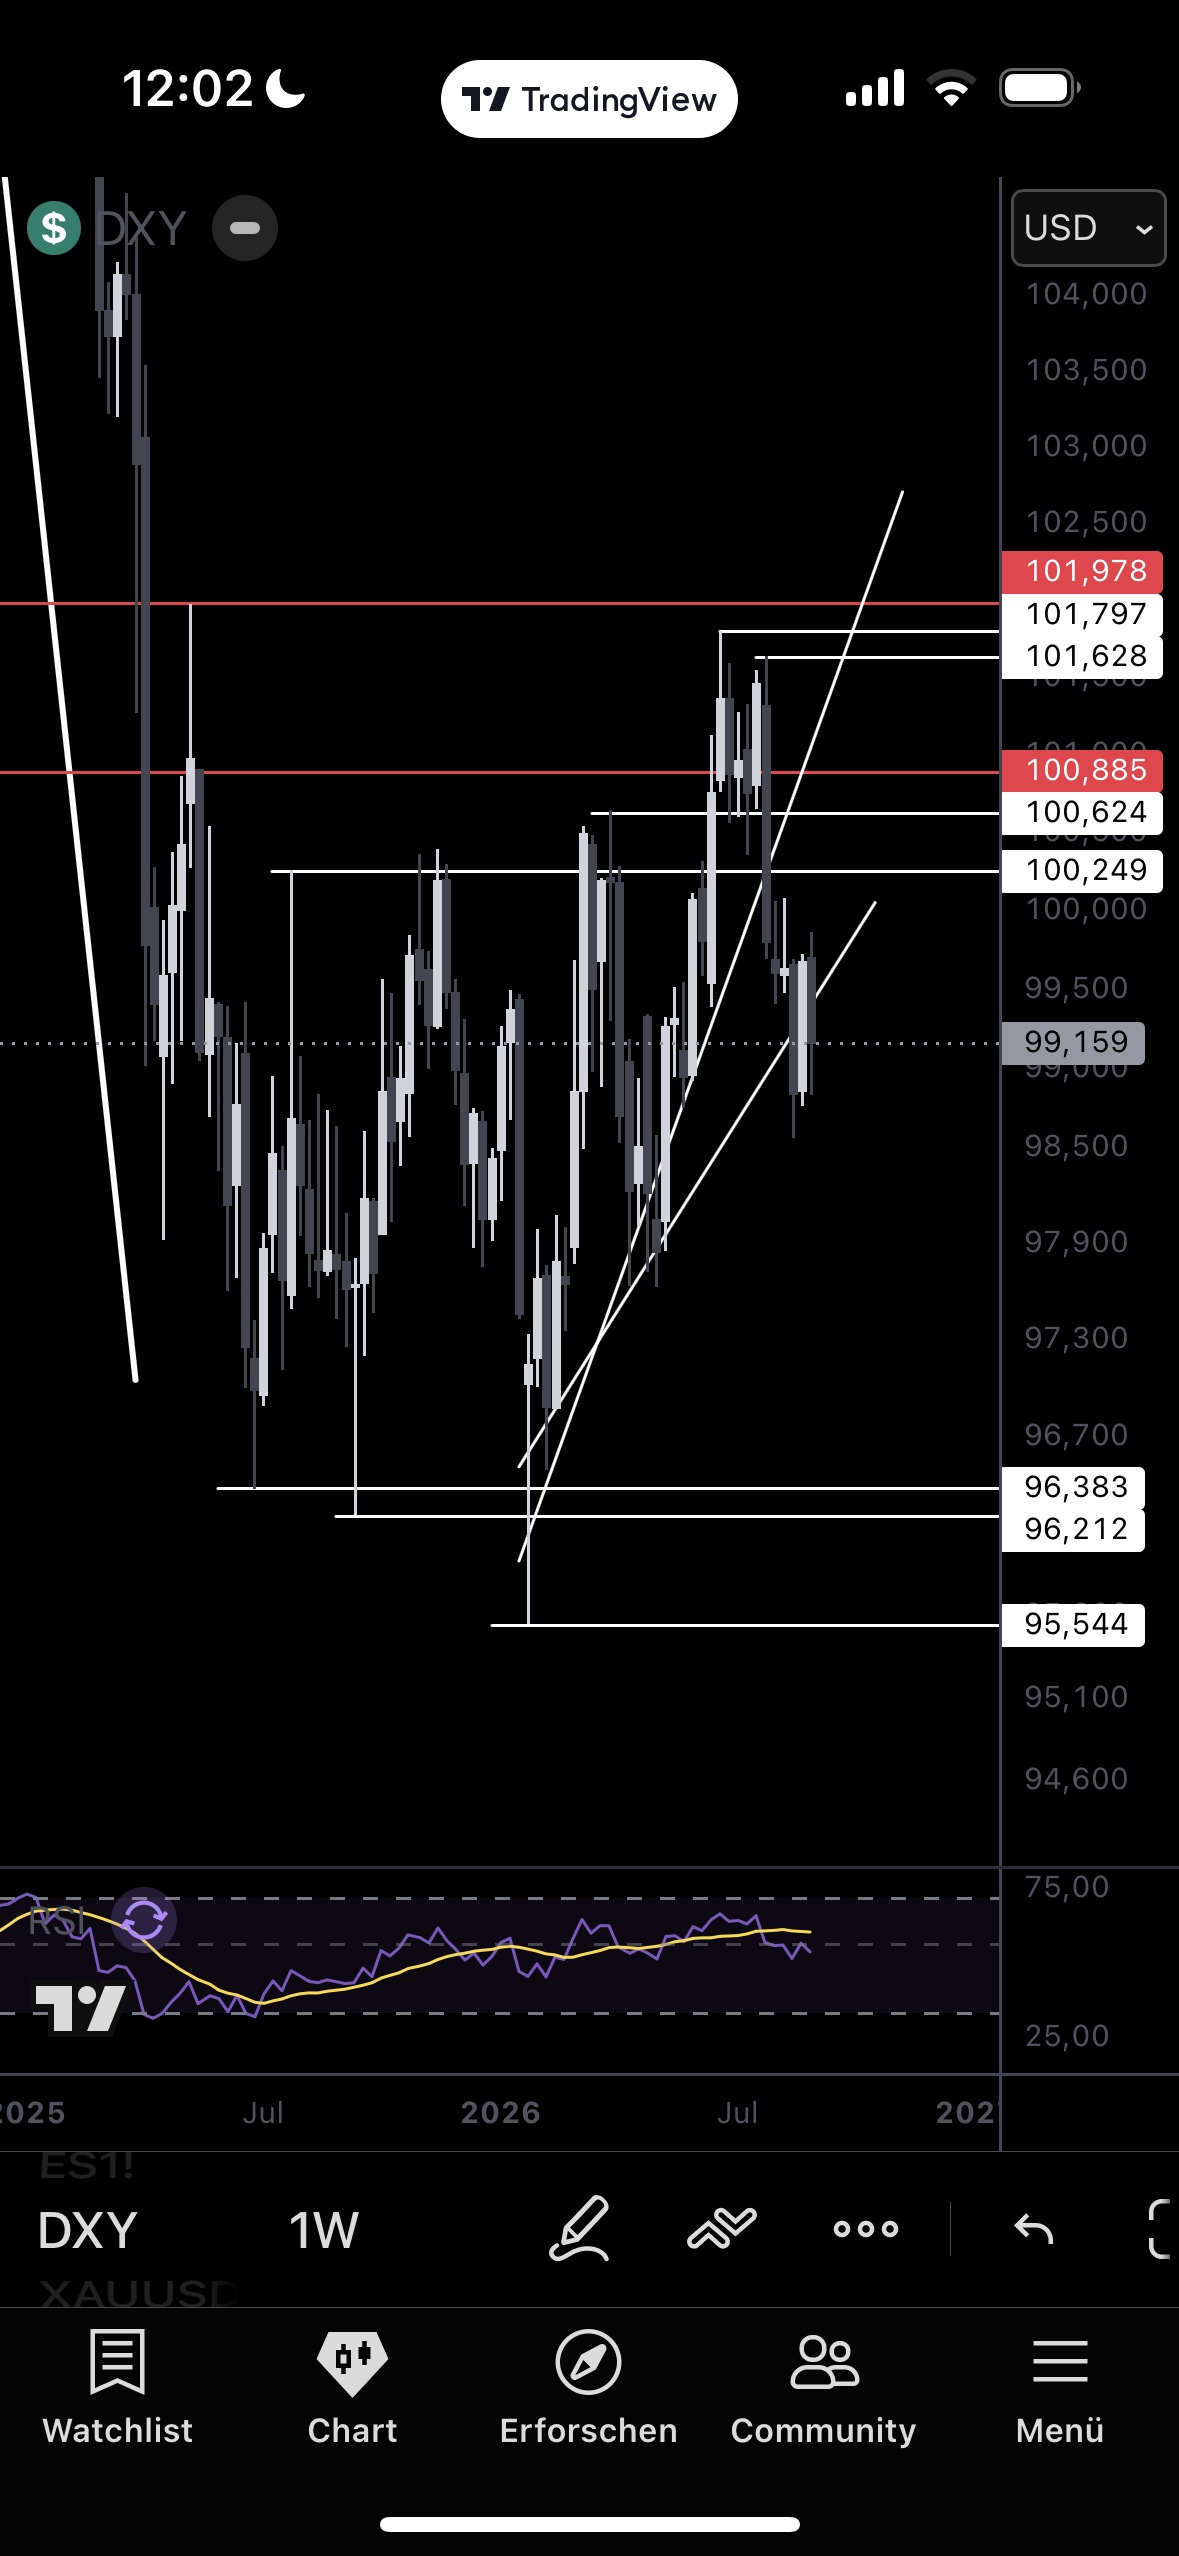
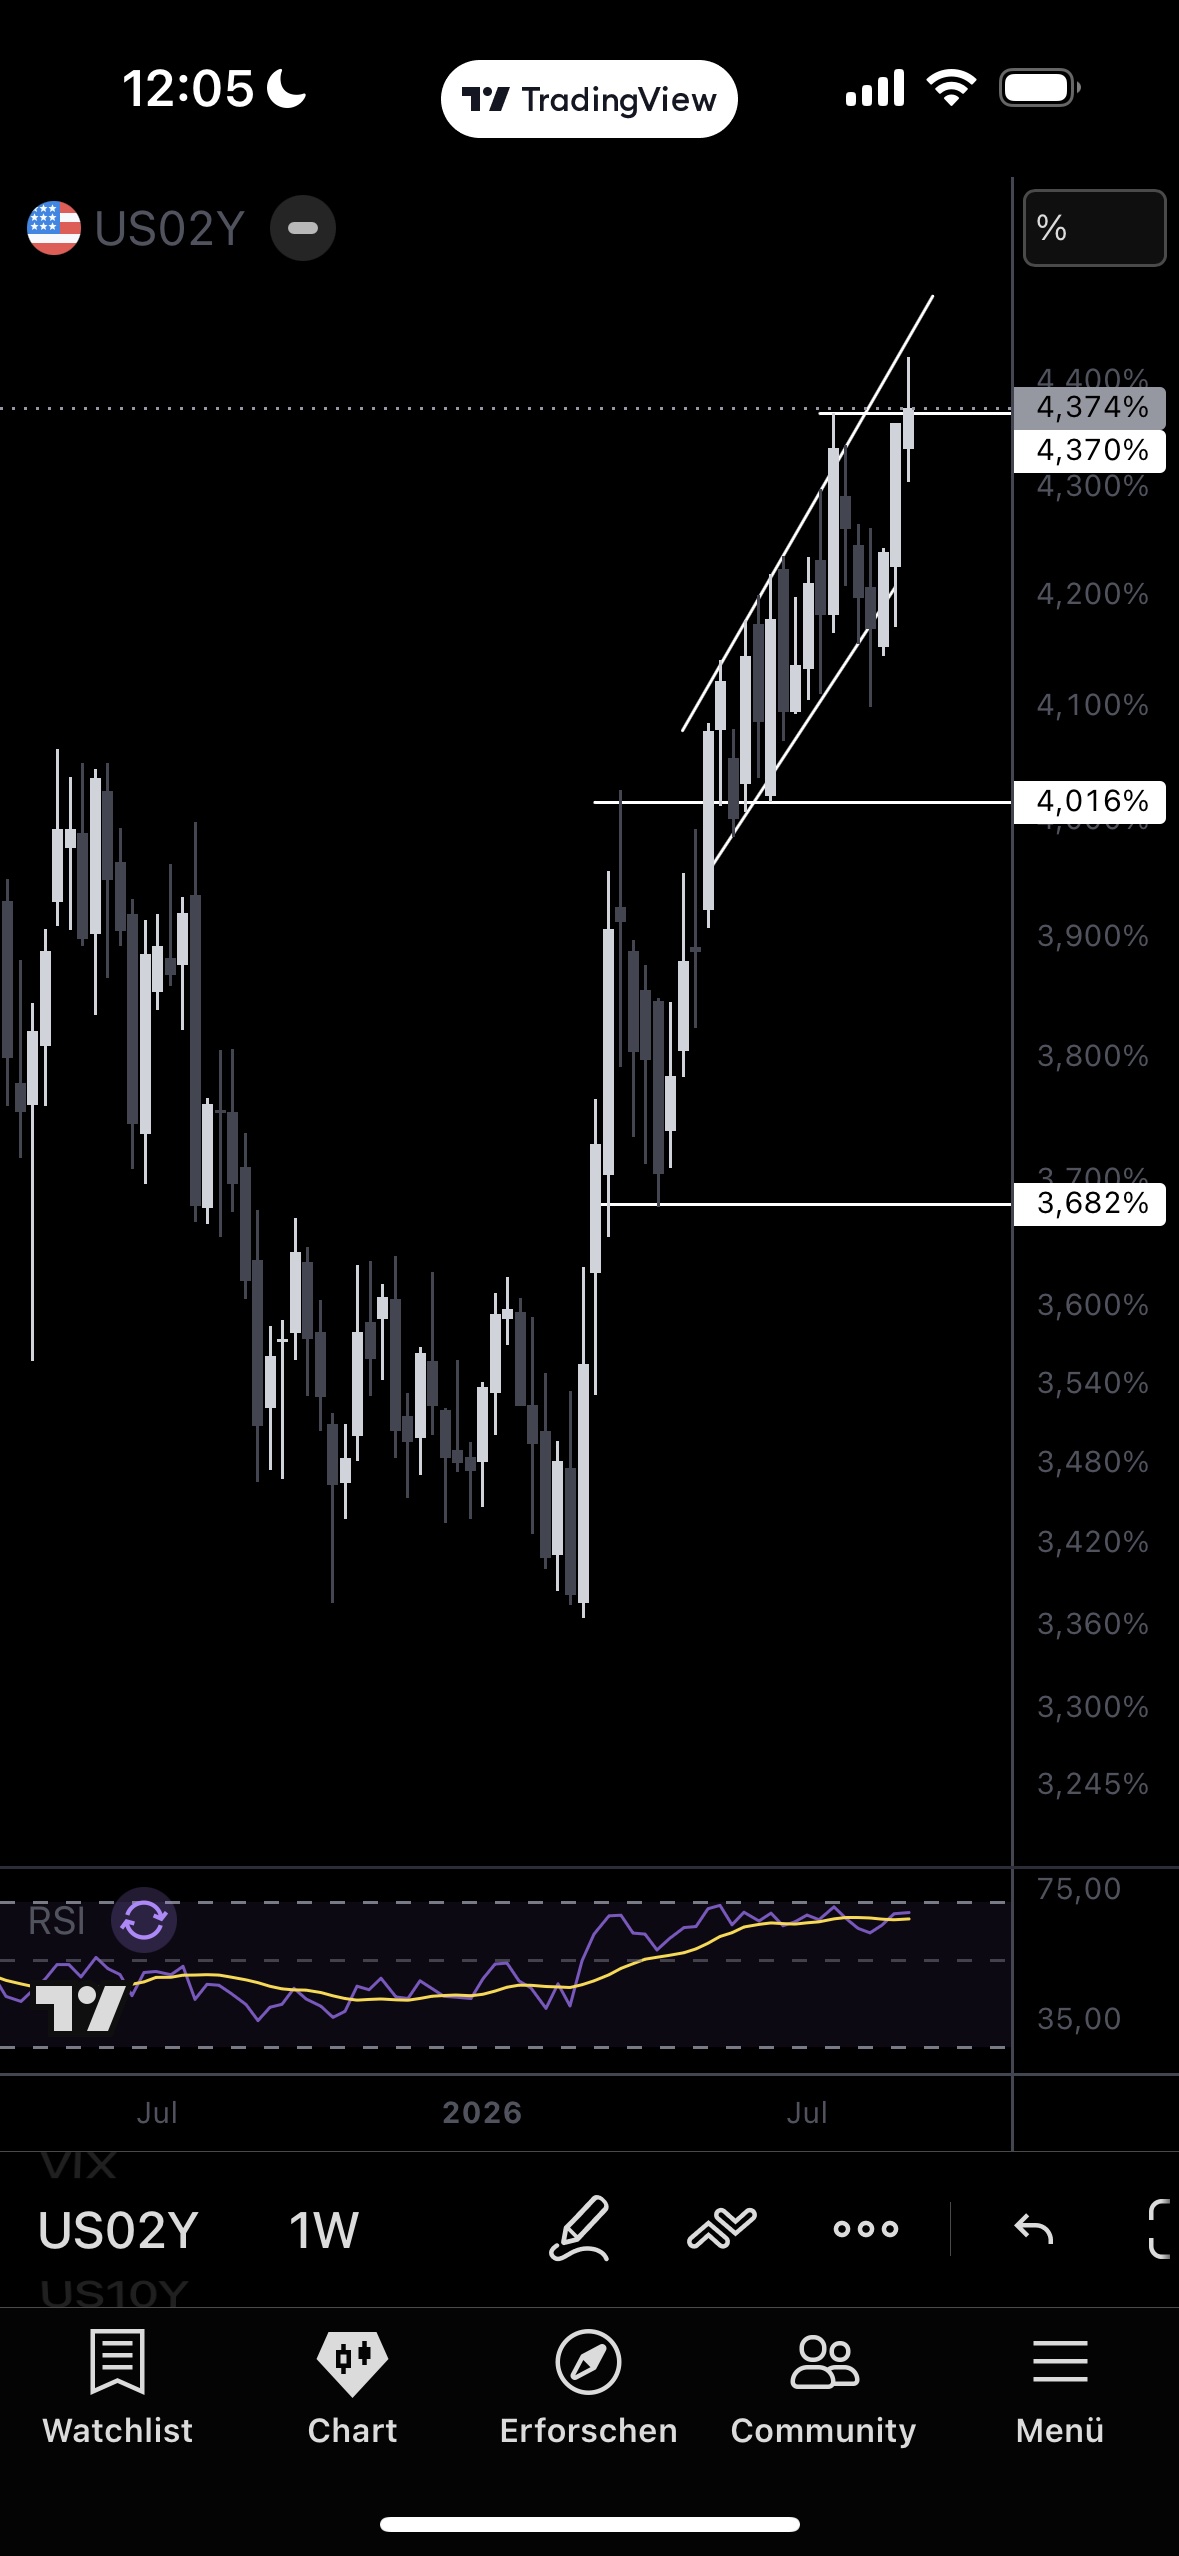
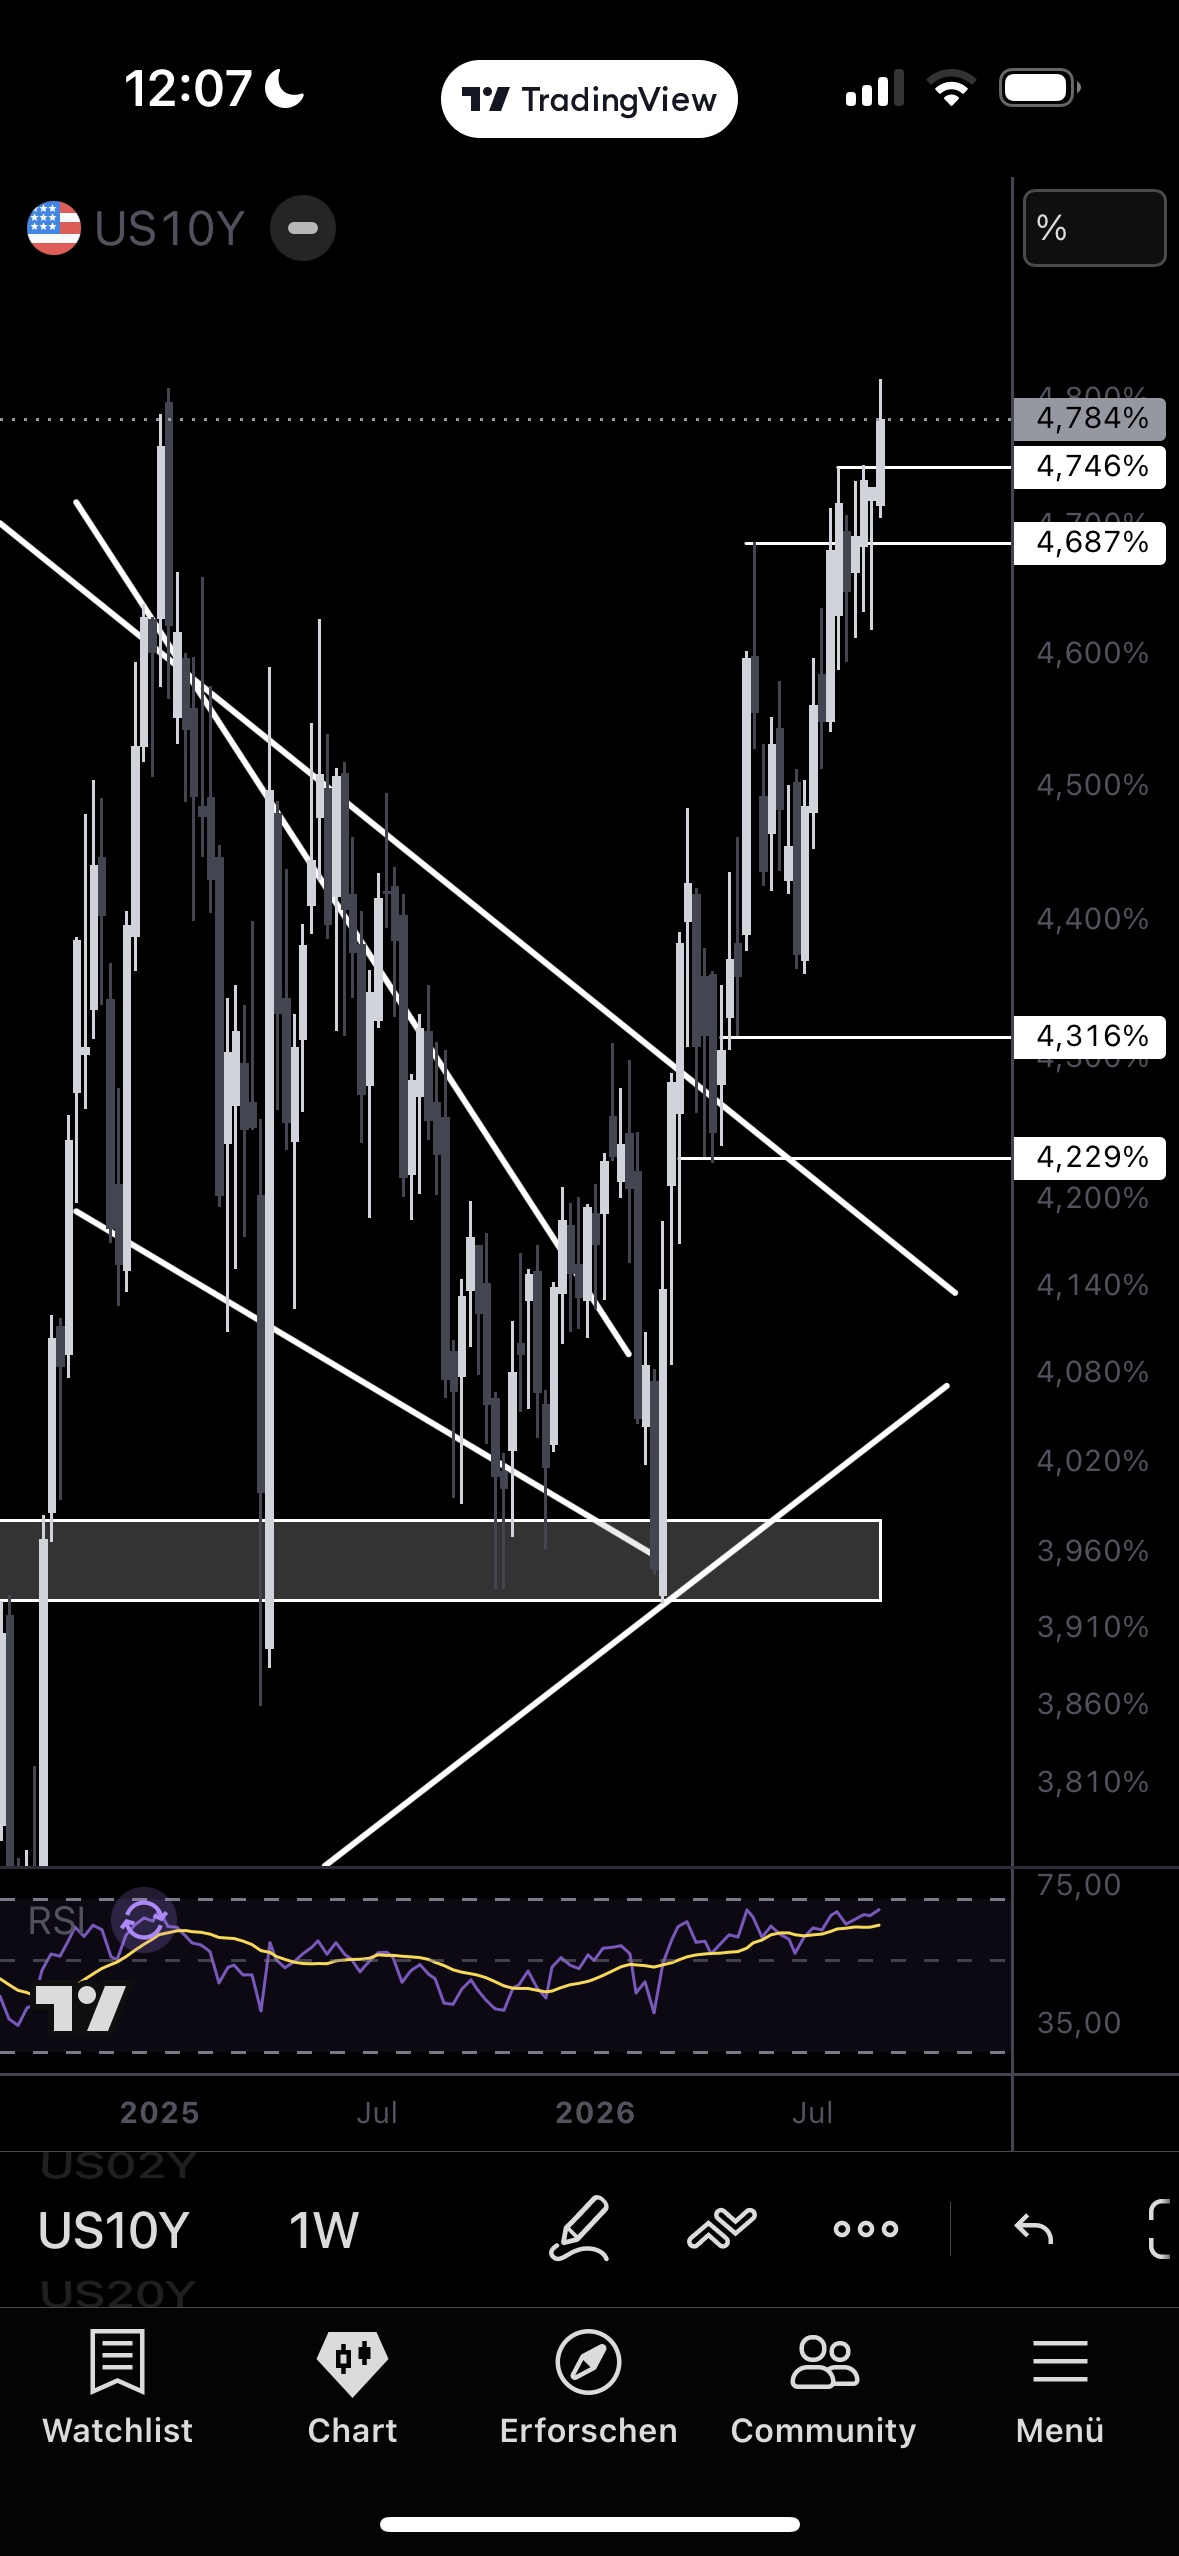
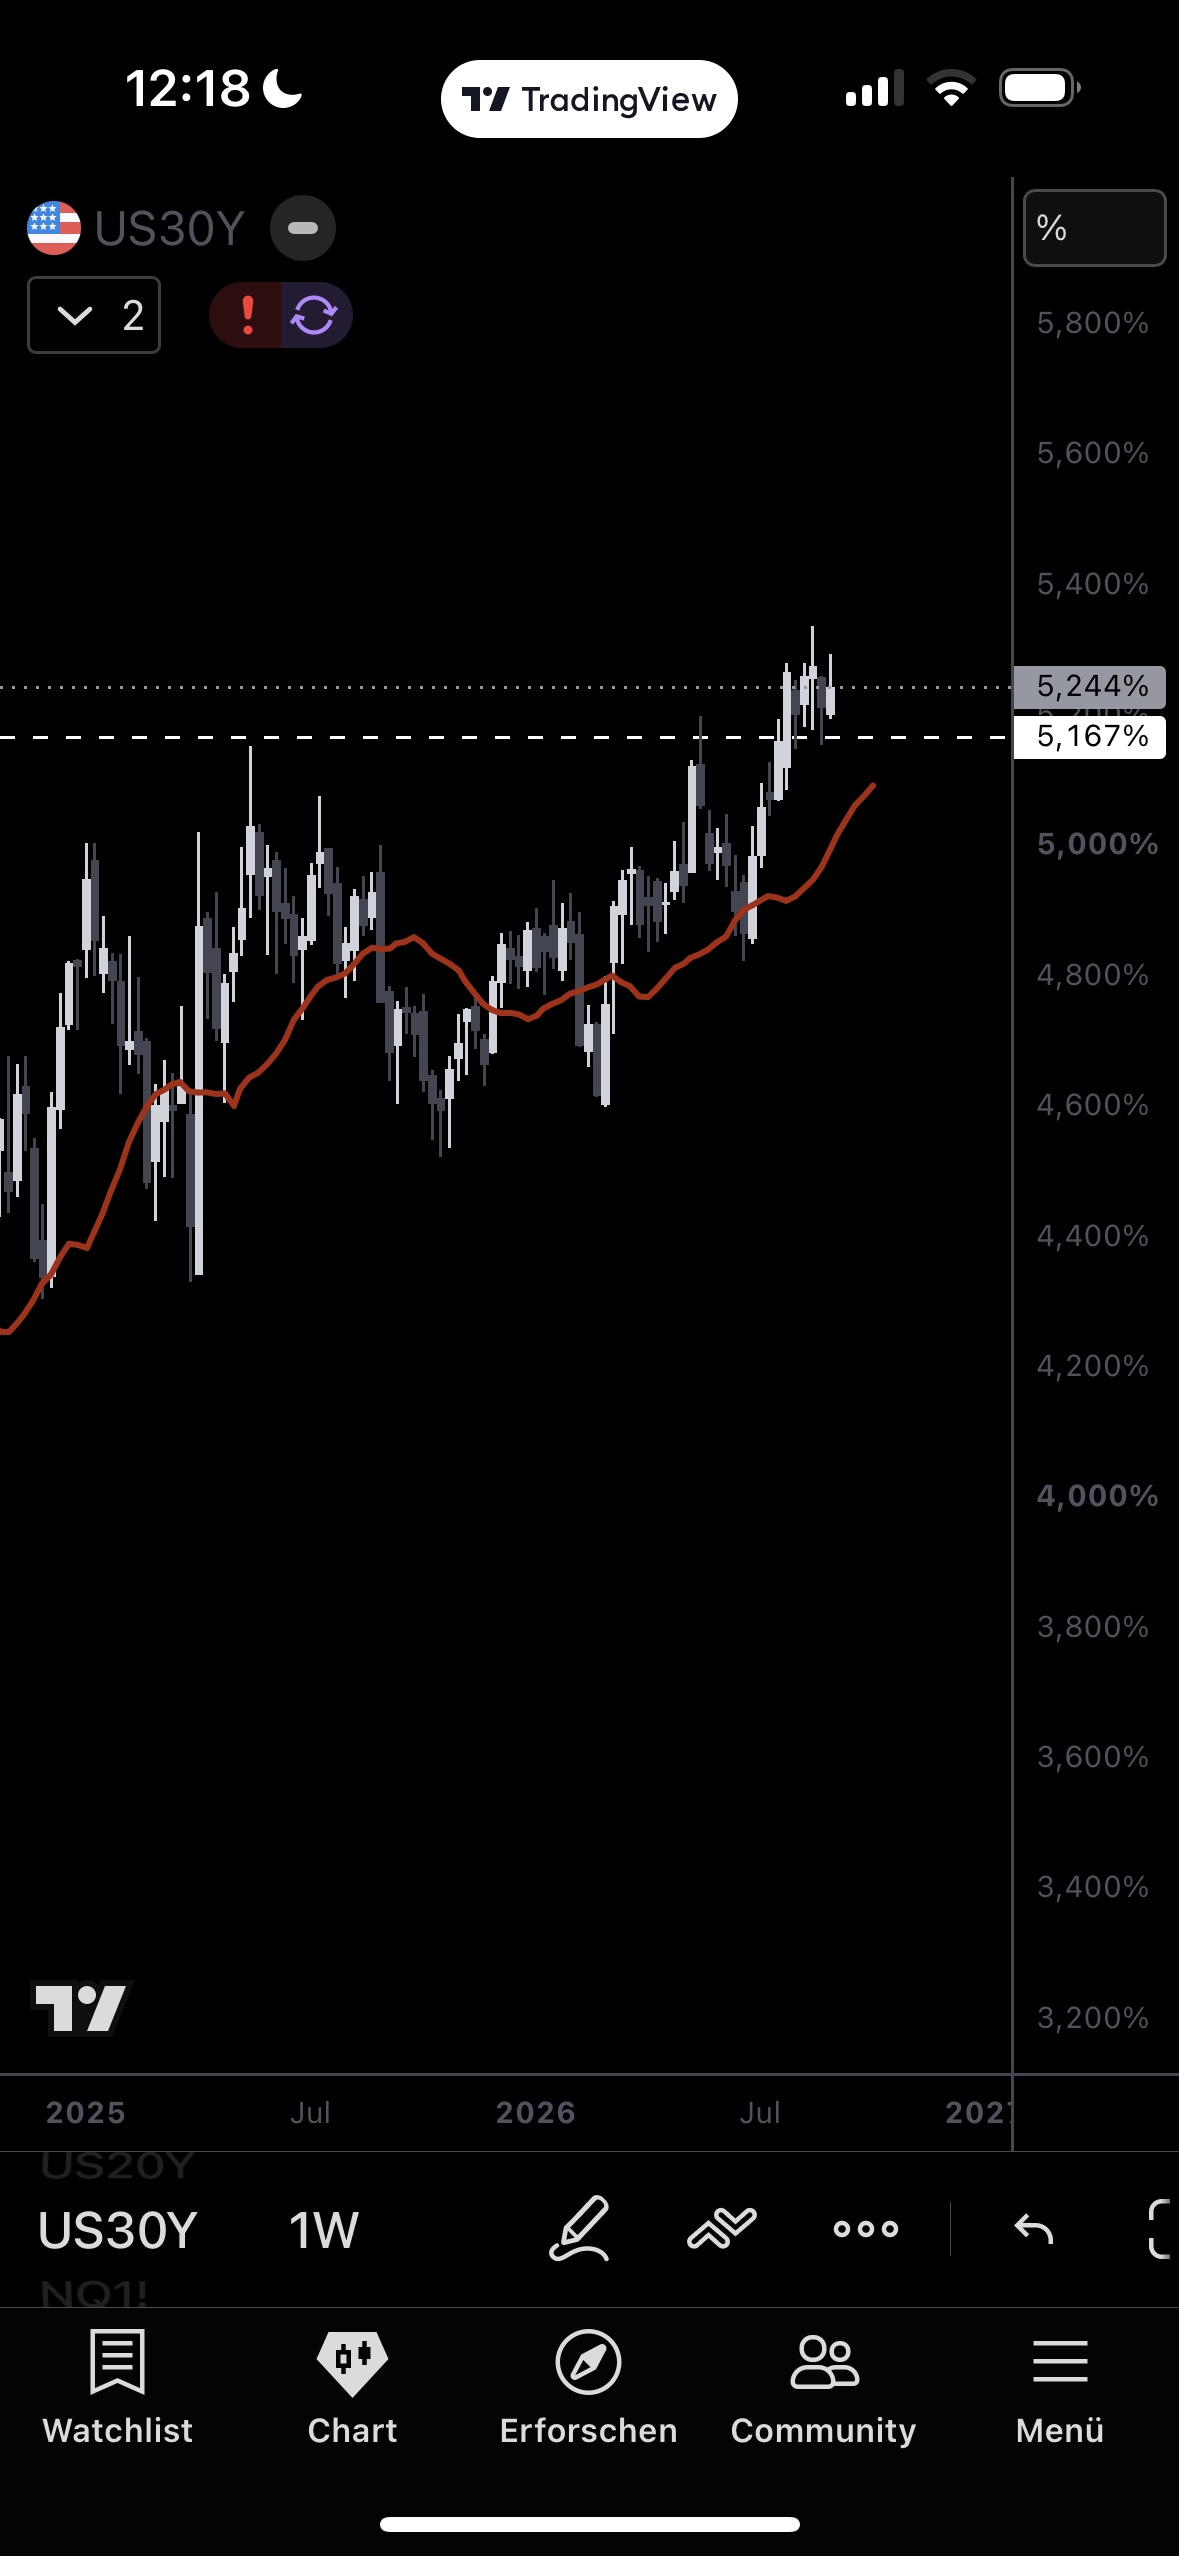
DXY 99.16 — recovering from the August lows but still below the 100.62–101.98 resistance cluster; dollar-bullish after NFP, yet no structural break of the bear structure. US02Y 4.37% (high 4.42%) — clean breakout from the rising channel, the clearest single confirmation of "higher for longer". US10Y 4.77–4.78%, high 4.816% — invalidation triggered. US20Y/30Y 5.25%/5.24% — no rollover at the long end either; the monthly uptrend since 2022 is accelerating.
Sparring — "rising yields = automatically bullish for gold"? Only if yields rise for fiscal/supply reasons (someone is selling USTs, buyers demand term premium) — that is gold-positive and fits Leg 5. This move, however, was demand/cycle-driven (strong labour market, Fed stays restrictive), i.e. real rates high — historically gold-negative. That US02Y of all tenors reacted most confirms Fed-path repricing, not a fiscal signal. Keep both mechanisms cleanly apart before using either to justify the rebuy.
Three metals, three reactions.
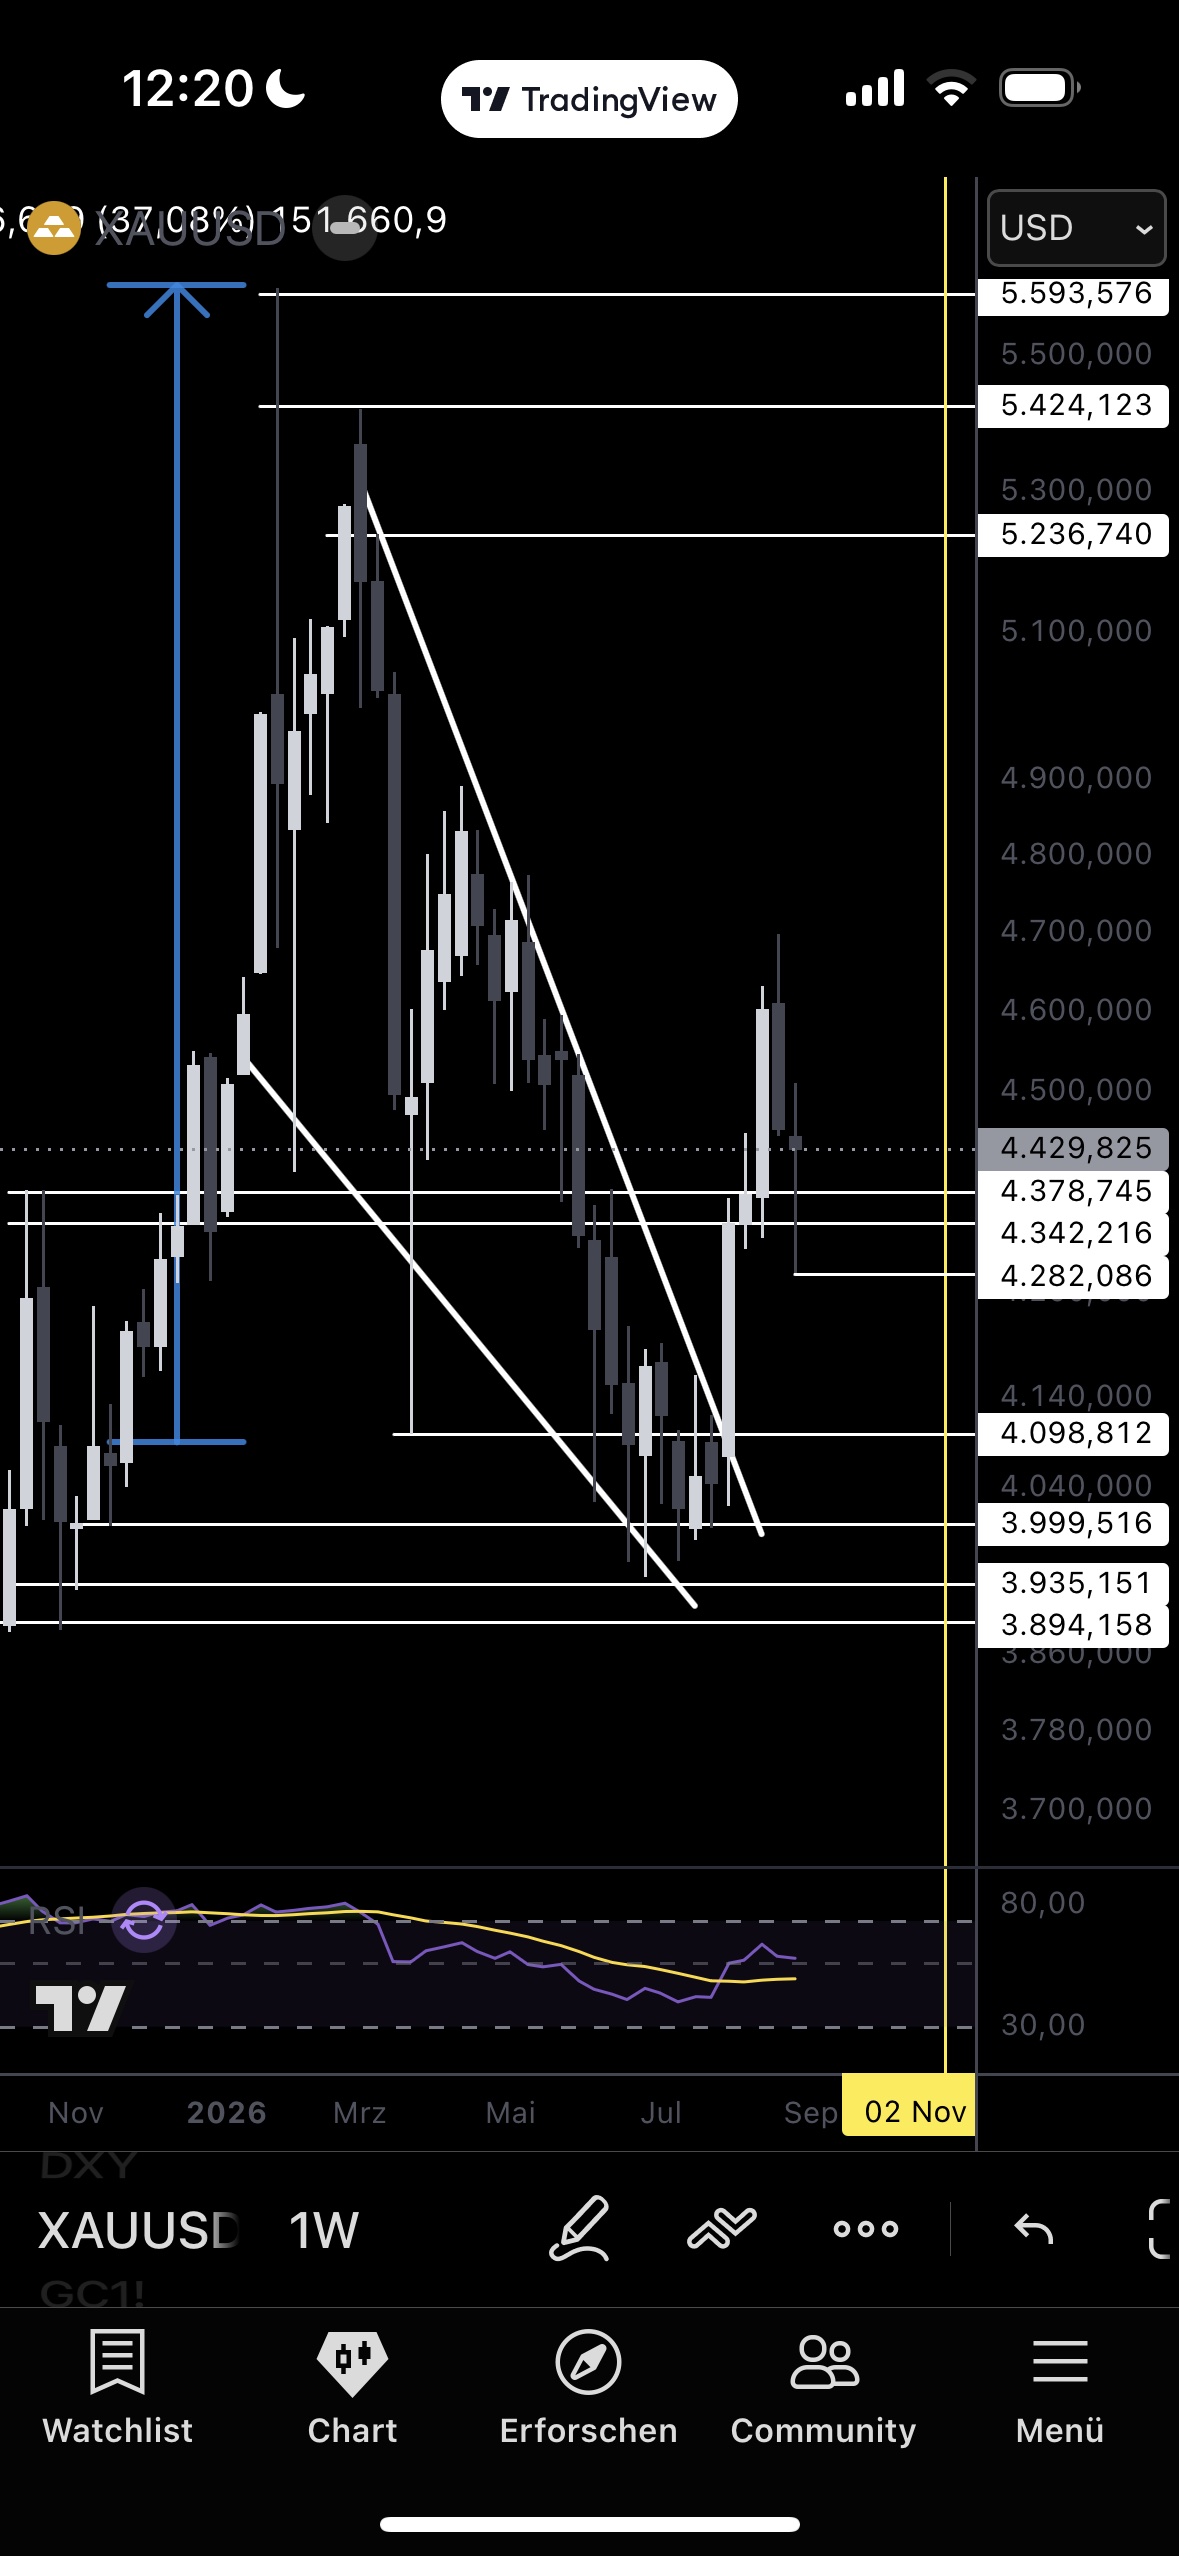
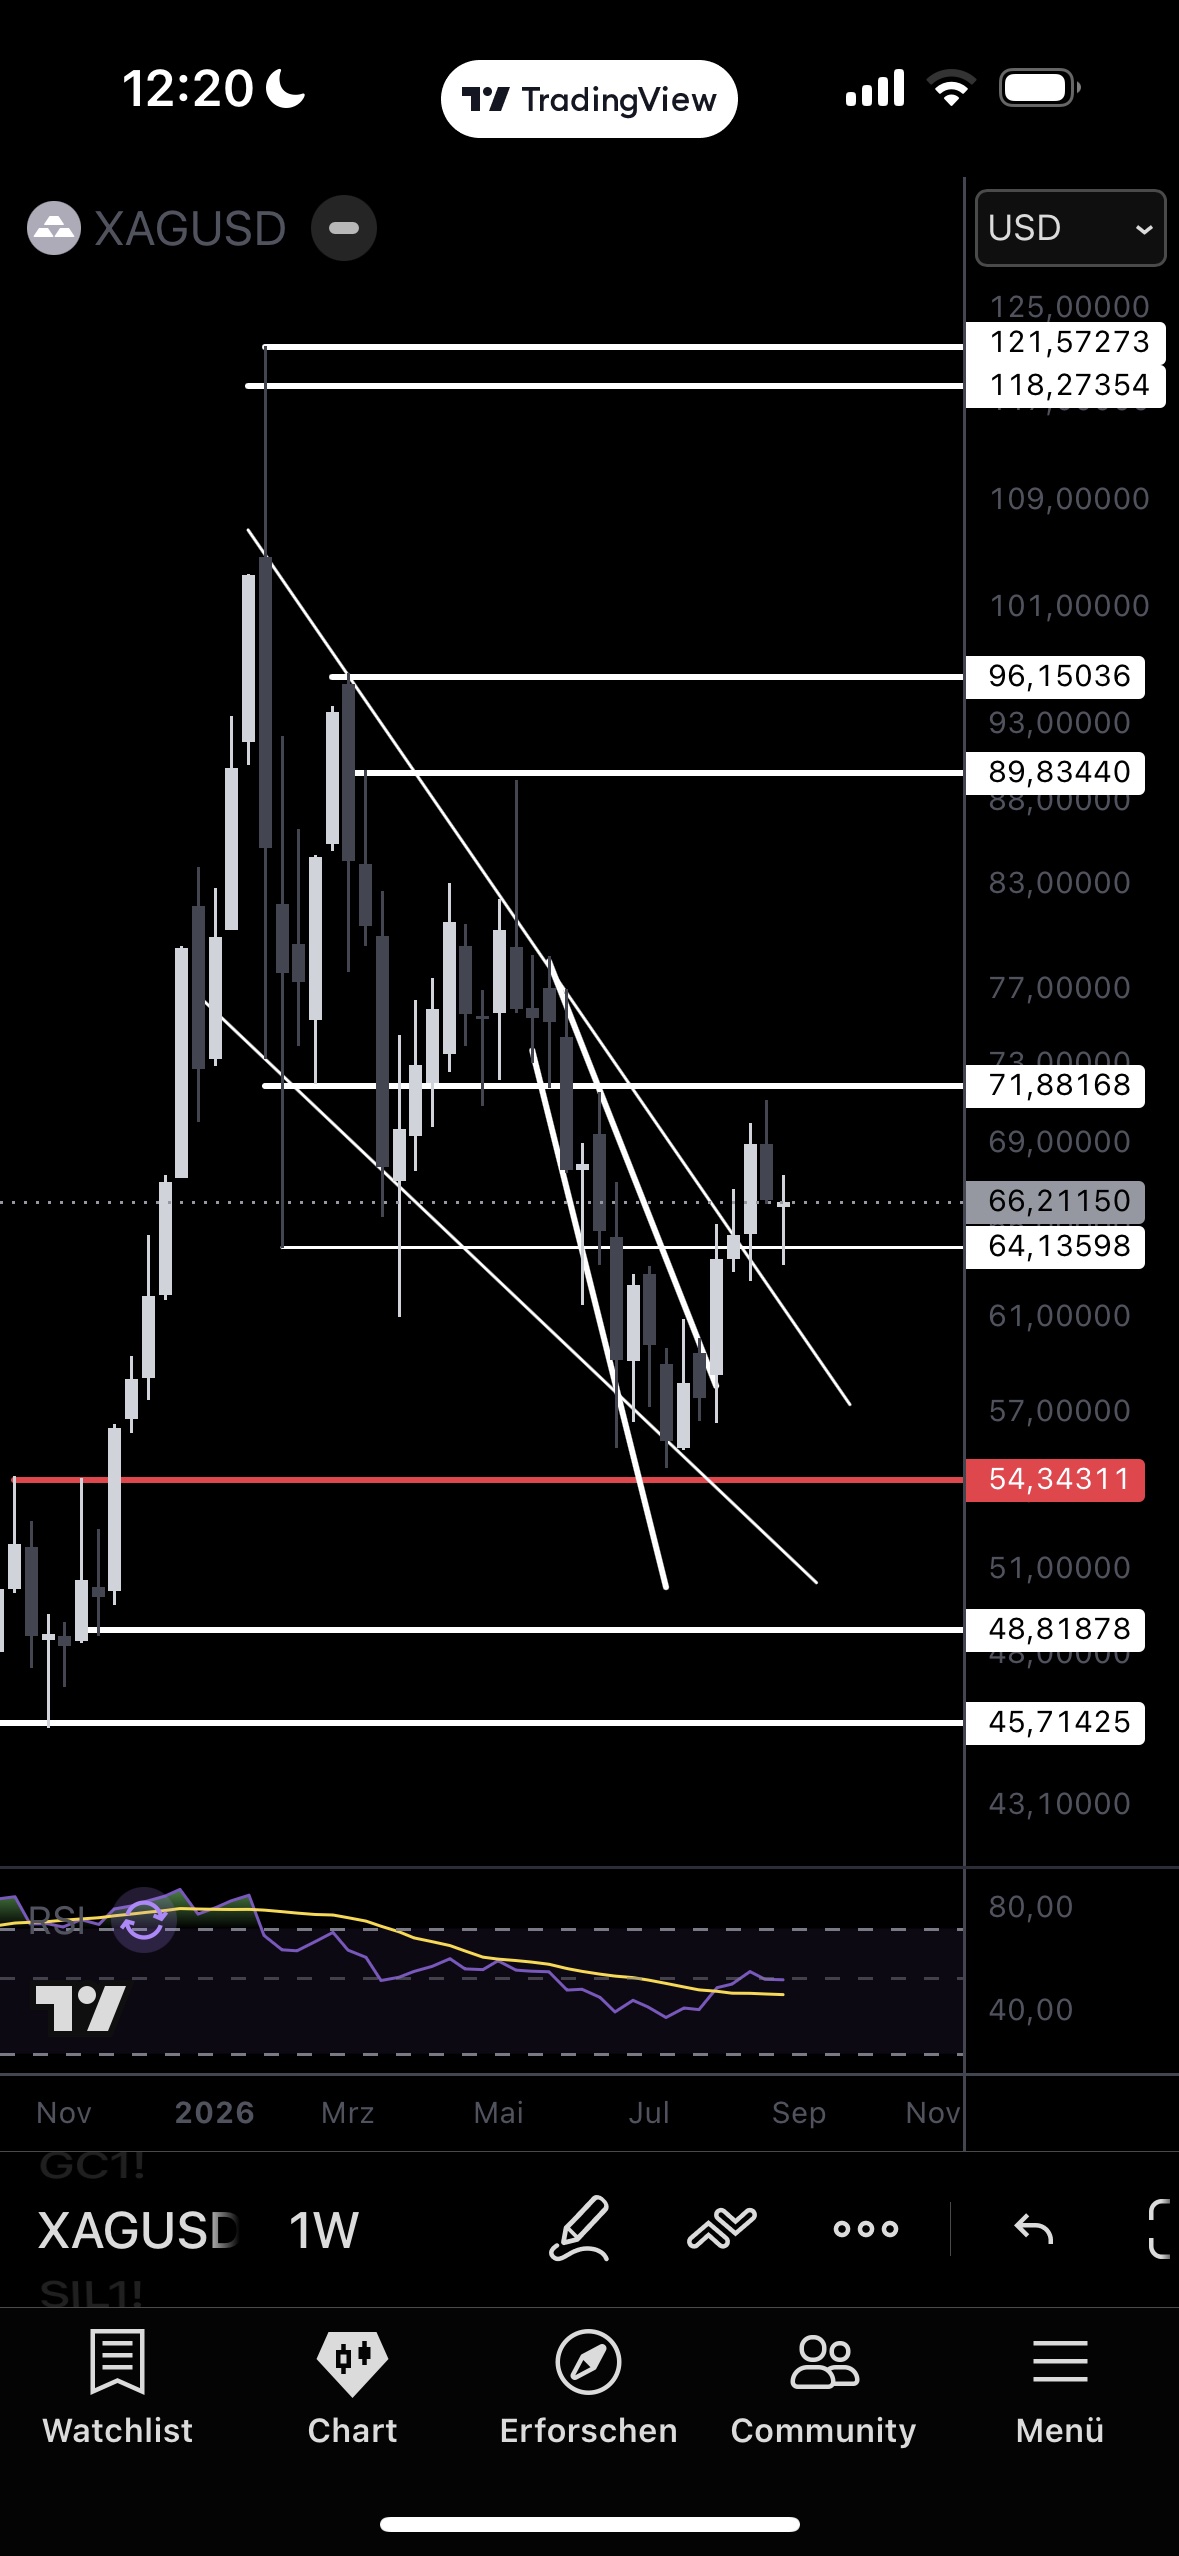
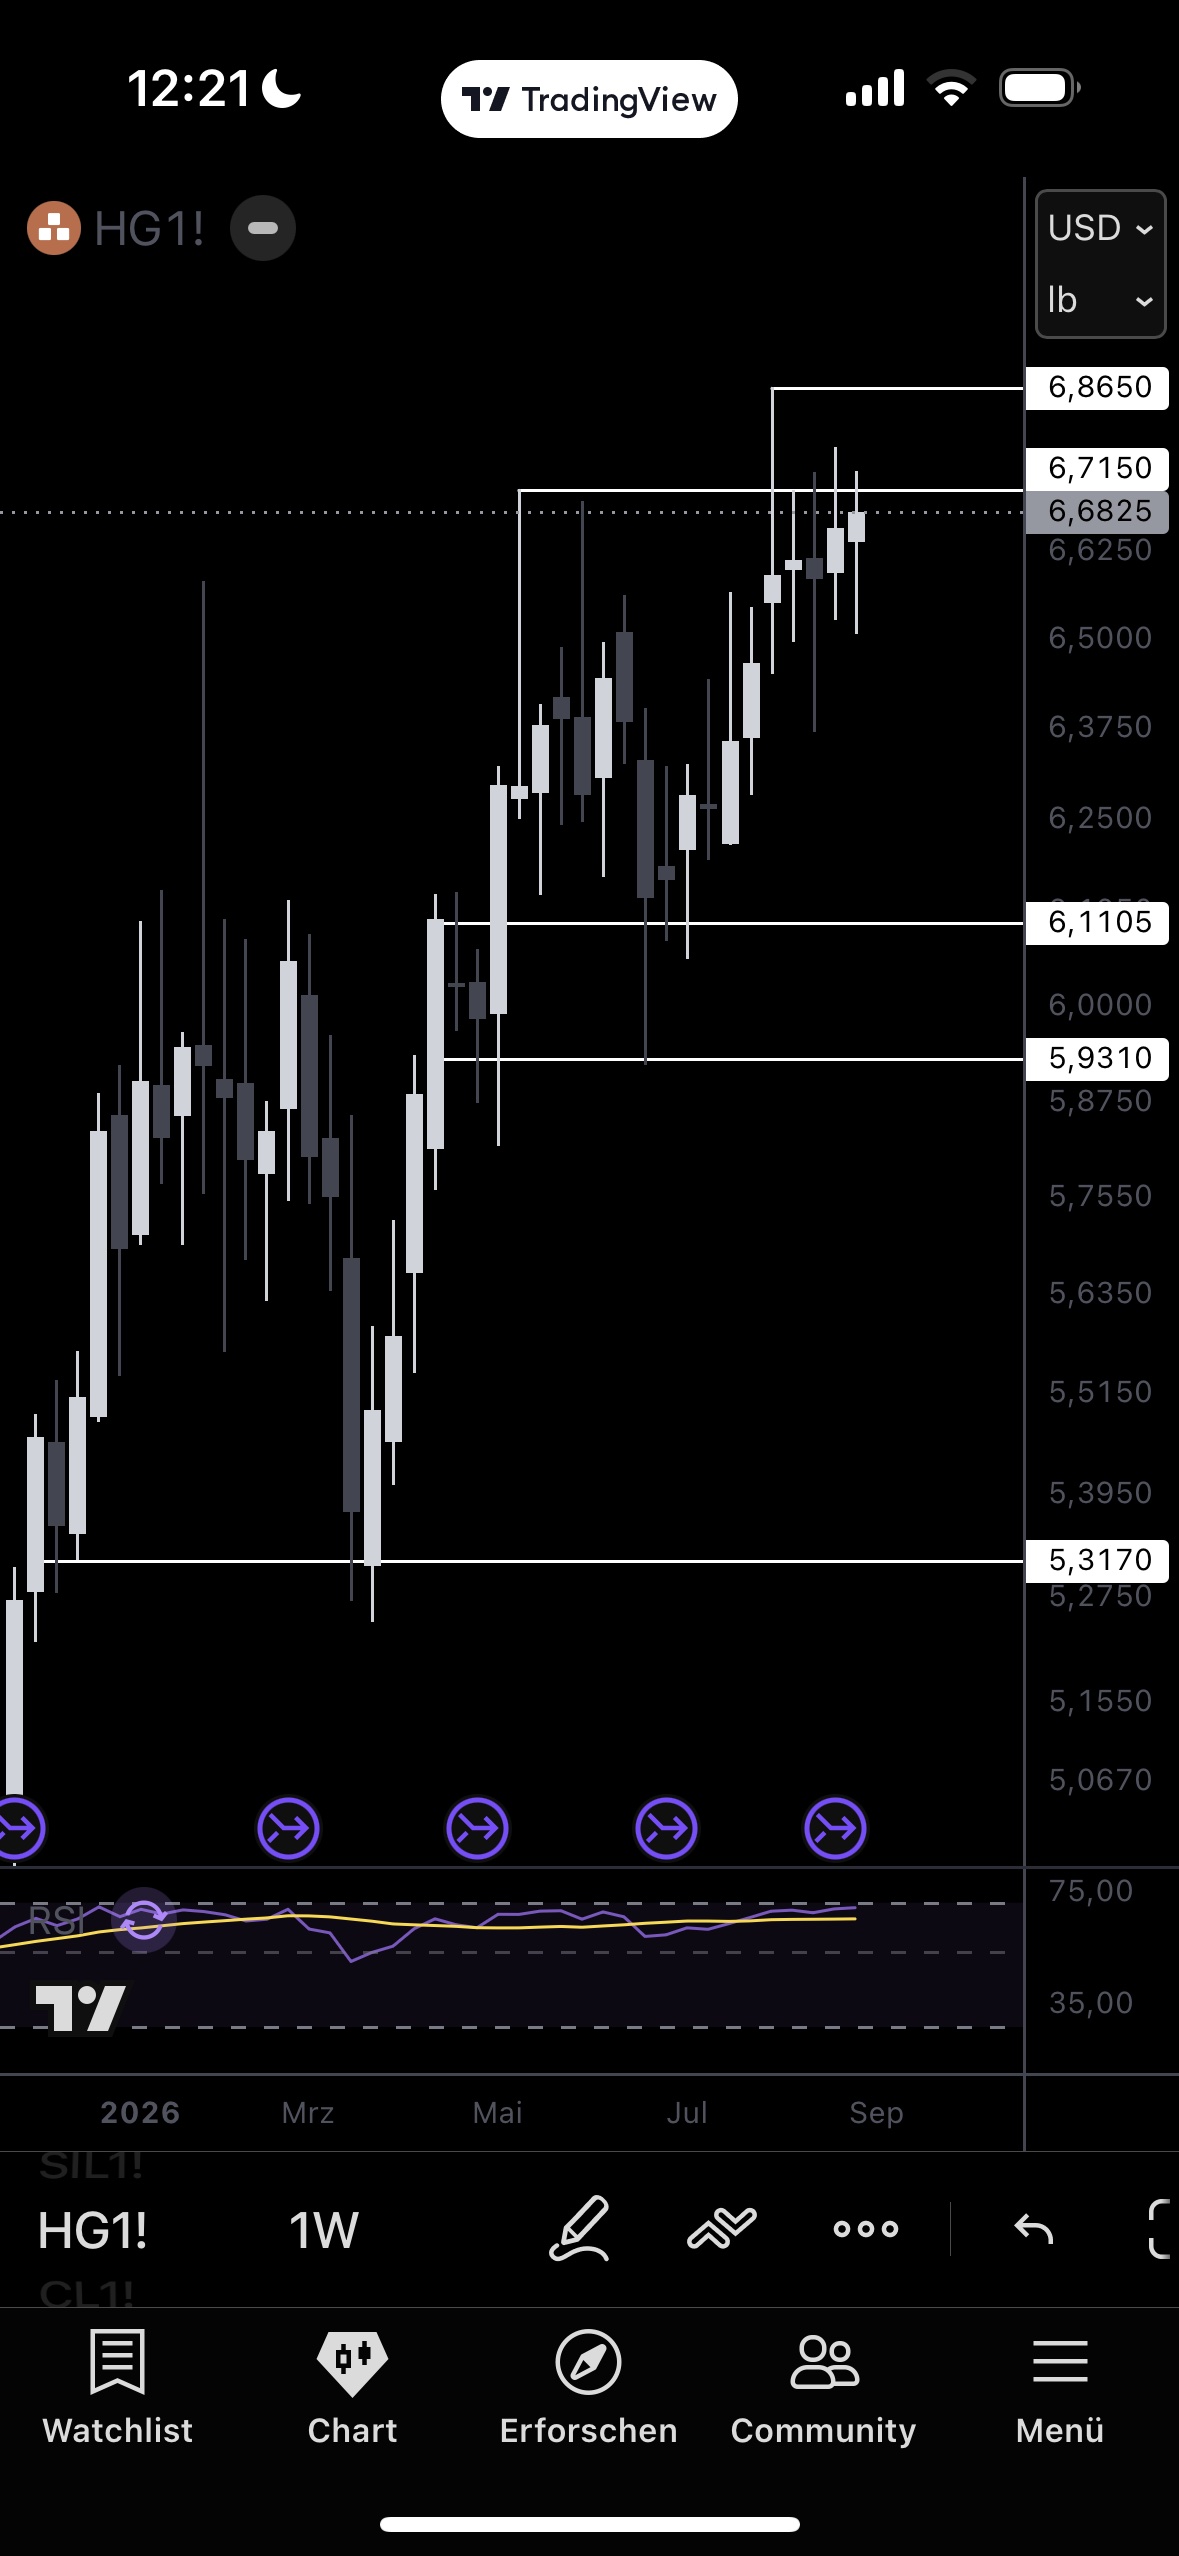
Gold (XAU) 4,430: correcting from the August high 4,697.7, broke the 4,450 intermediate zone, now trading 4,378–4,430. The first metal position visibly reacting to the rate/dollar headwind. The 37% move stays structurally intact as long as 4,098–4,283 does not break sustainably. Silver (XAG) 66.21: notably more robust — a pullback from the 67.45 high into a tight 66.1–66.8 range rather than a break; the industrial demand component helps. Copper (HG) 6.67–6.68: the strongest of the three — consolidating just below the 6.70–6.78 cluster, no correction despite NFP. Copper's relative strength fits the growth story, gold's weakness fits the same narrative — internally consistent, not contradictory.
Next week's trigger points: Treasury buyback operational from Sep 9 · PPI ~Sep 9/10 · CPI Sep 11 · September IB close Fri Sep 11 · Retail Sales Sep 16 · FOMC Sep 15–16 · gold holding 4,283 · silver holding 66.13 · copper confirmation 6.865 · FCX cluster 70.70–72.04.
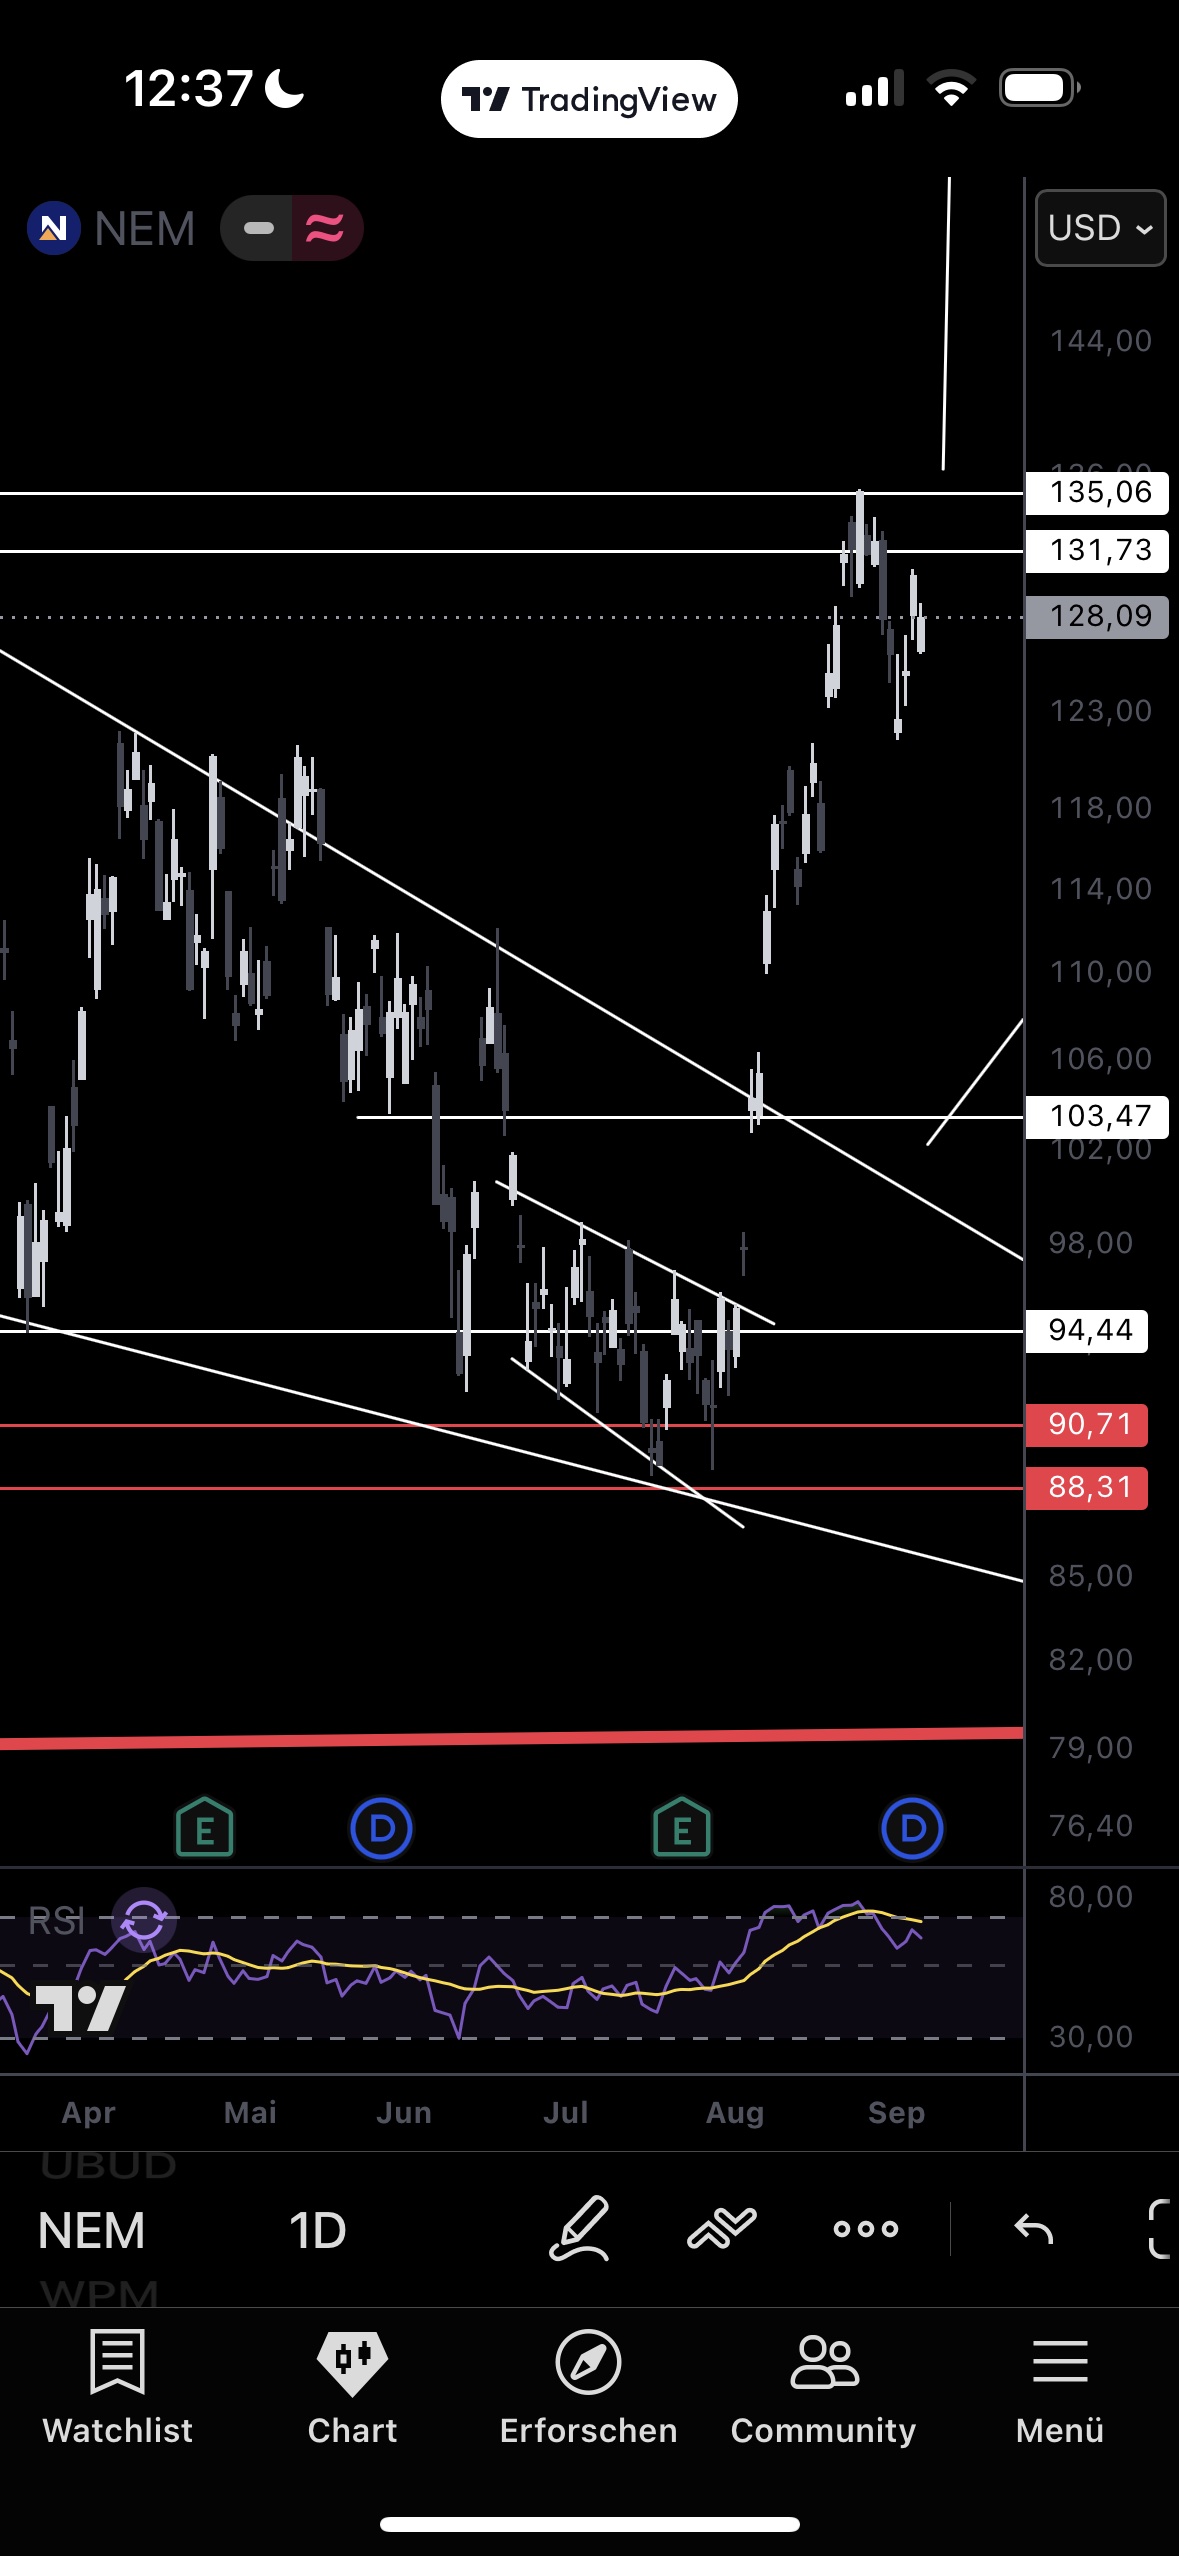
Newmont: second breather, trigger held.
1D
4H
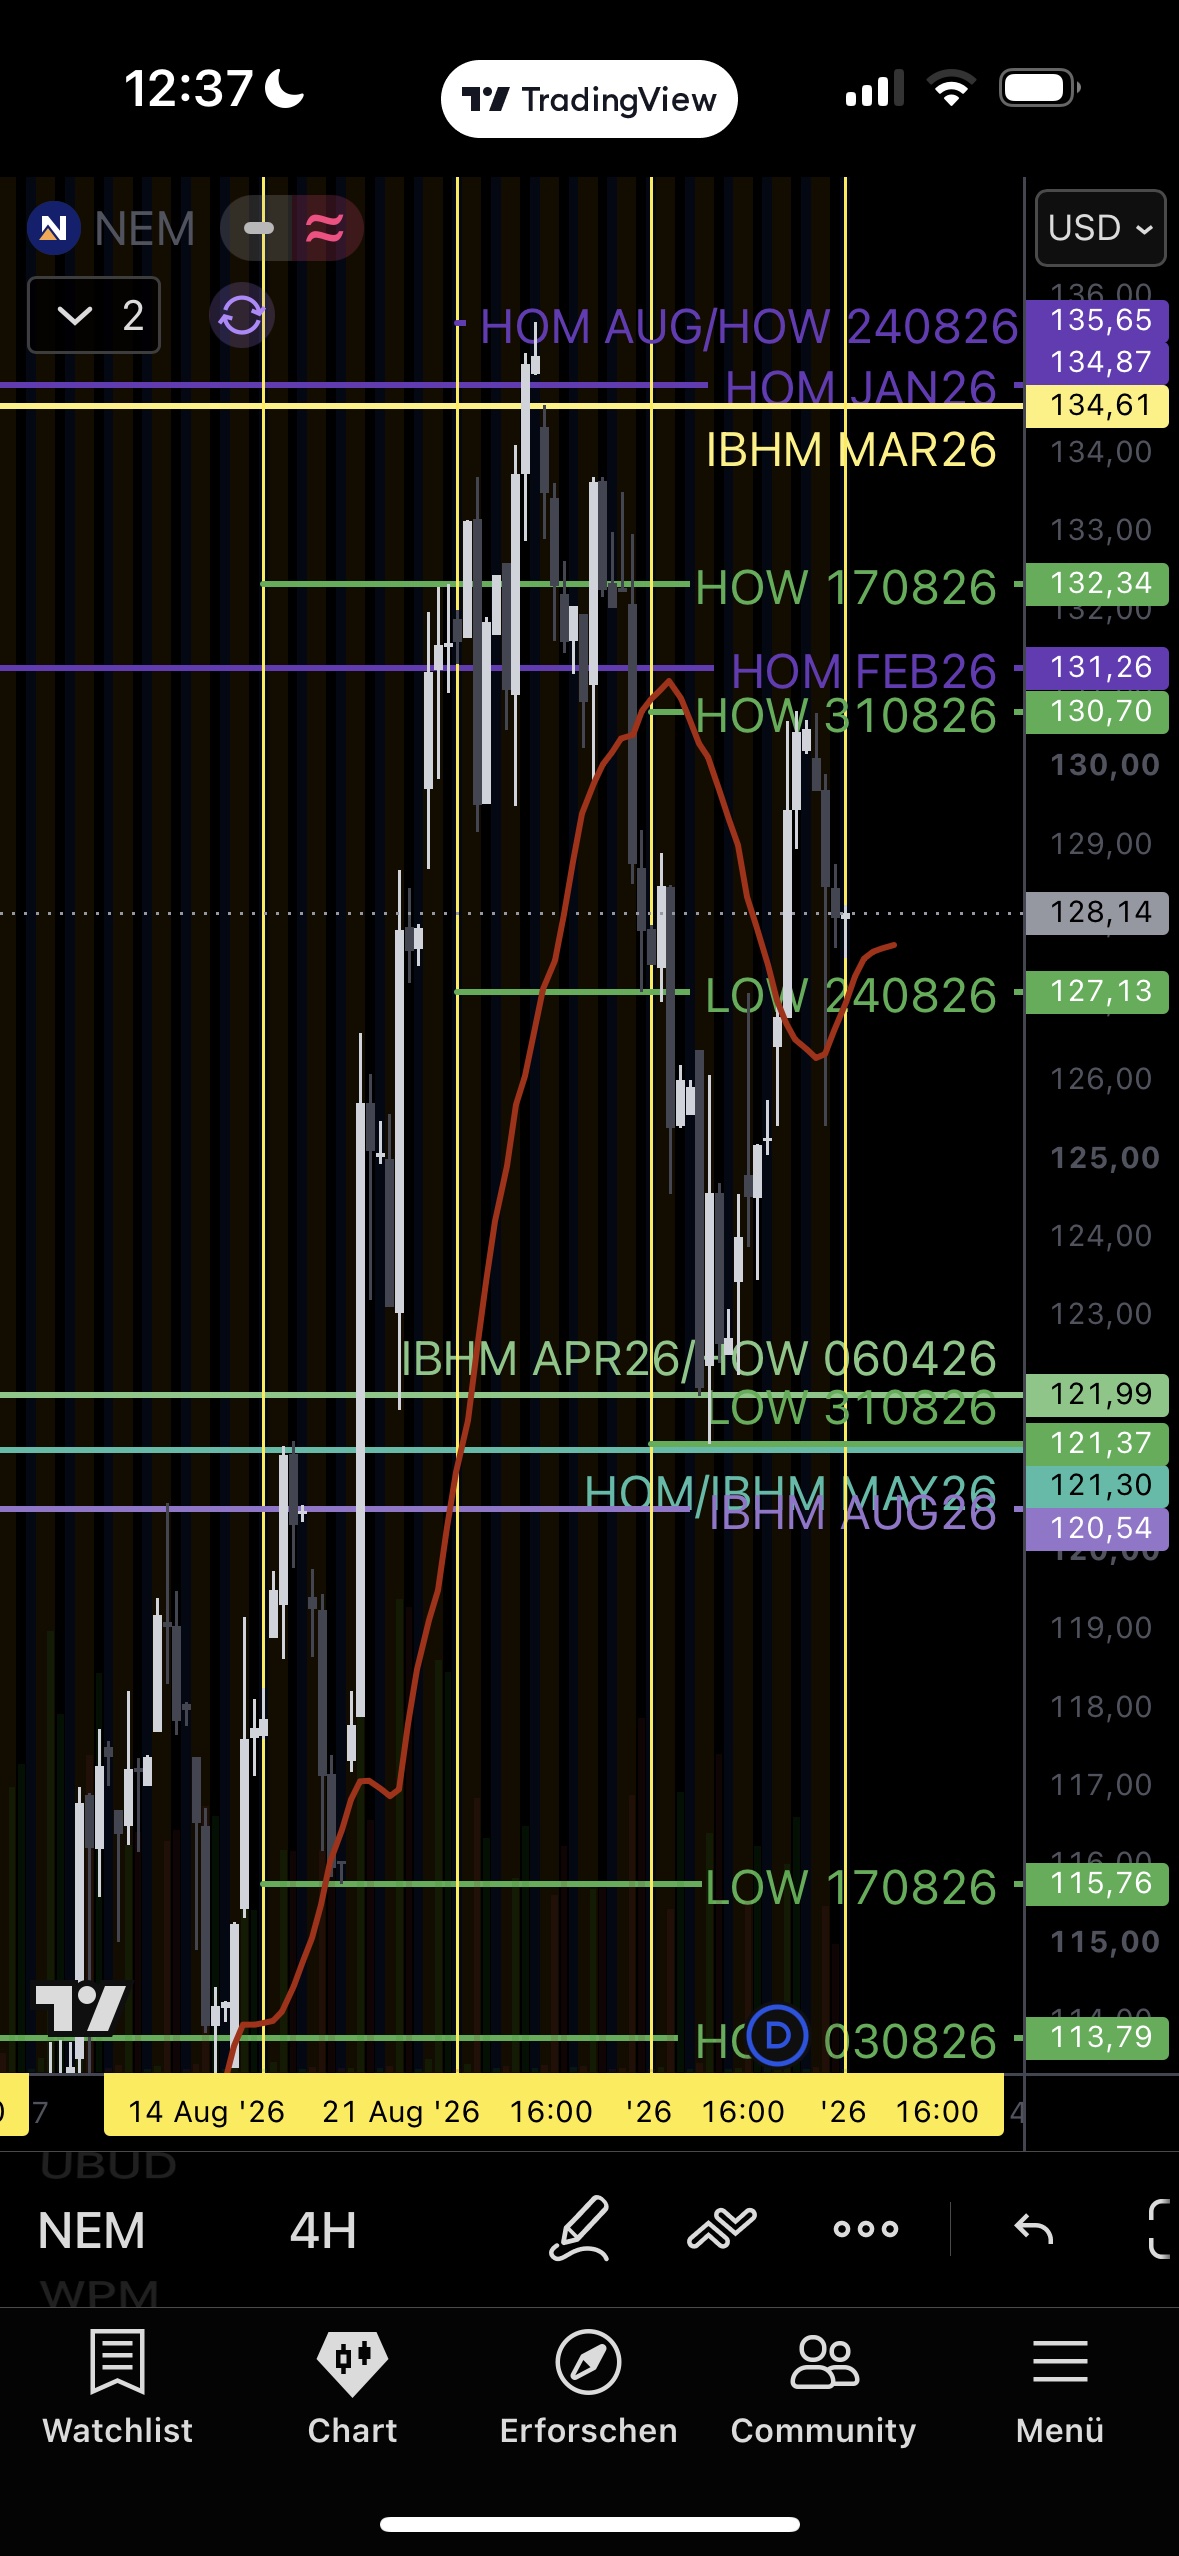
Second consolidation week after the 135.65 ATH touch, no structural break: rejection at 132.34/131.26, drop to 127.13, recovery to 128.14. New intermediate resistance HOW310826 at 130.70. As long as 127.13 holds, "healthy breather after reaching the target" remains the base case; a daily close below opens the discussion toward 121.99. The exit trigger (weekly close < 127.13) was tested intraday, not triggered. Positions unchanged: 135C (6L) and JUN27 120C (1L); trim per the 140/150/160 ladder or on trigger.
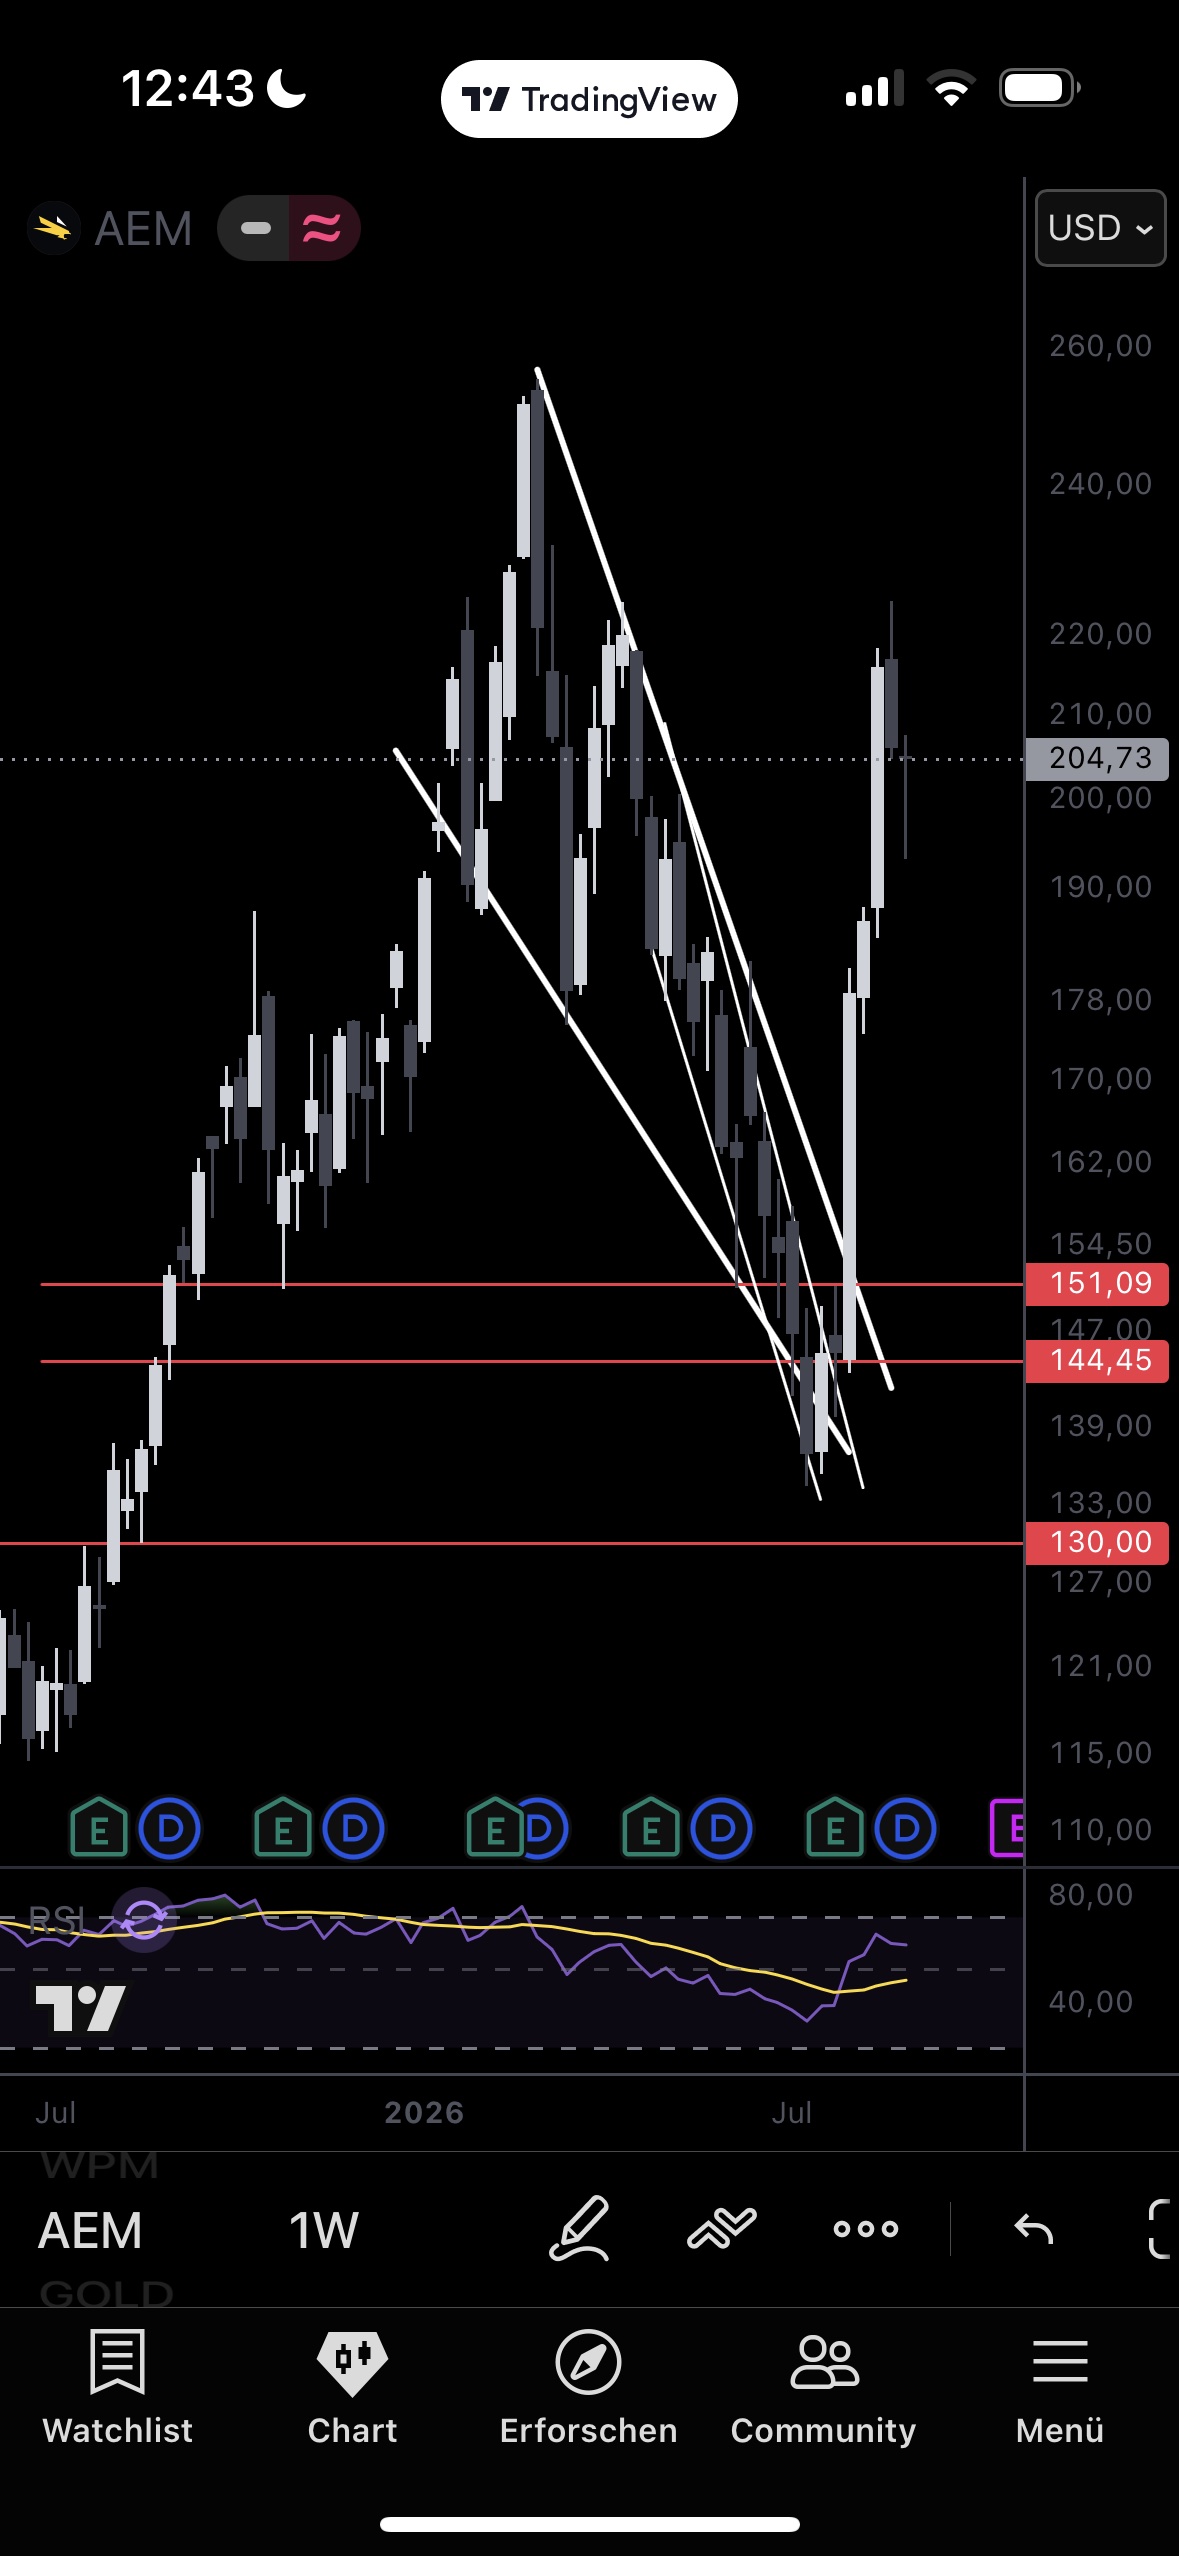
Agnico Eagle: V-low held.
1D
4H
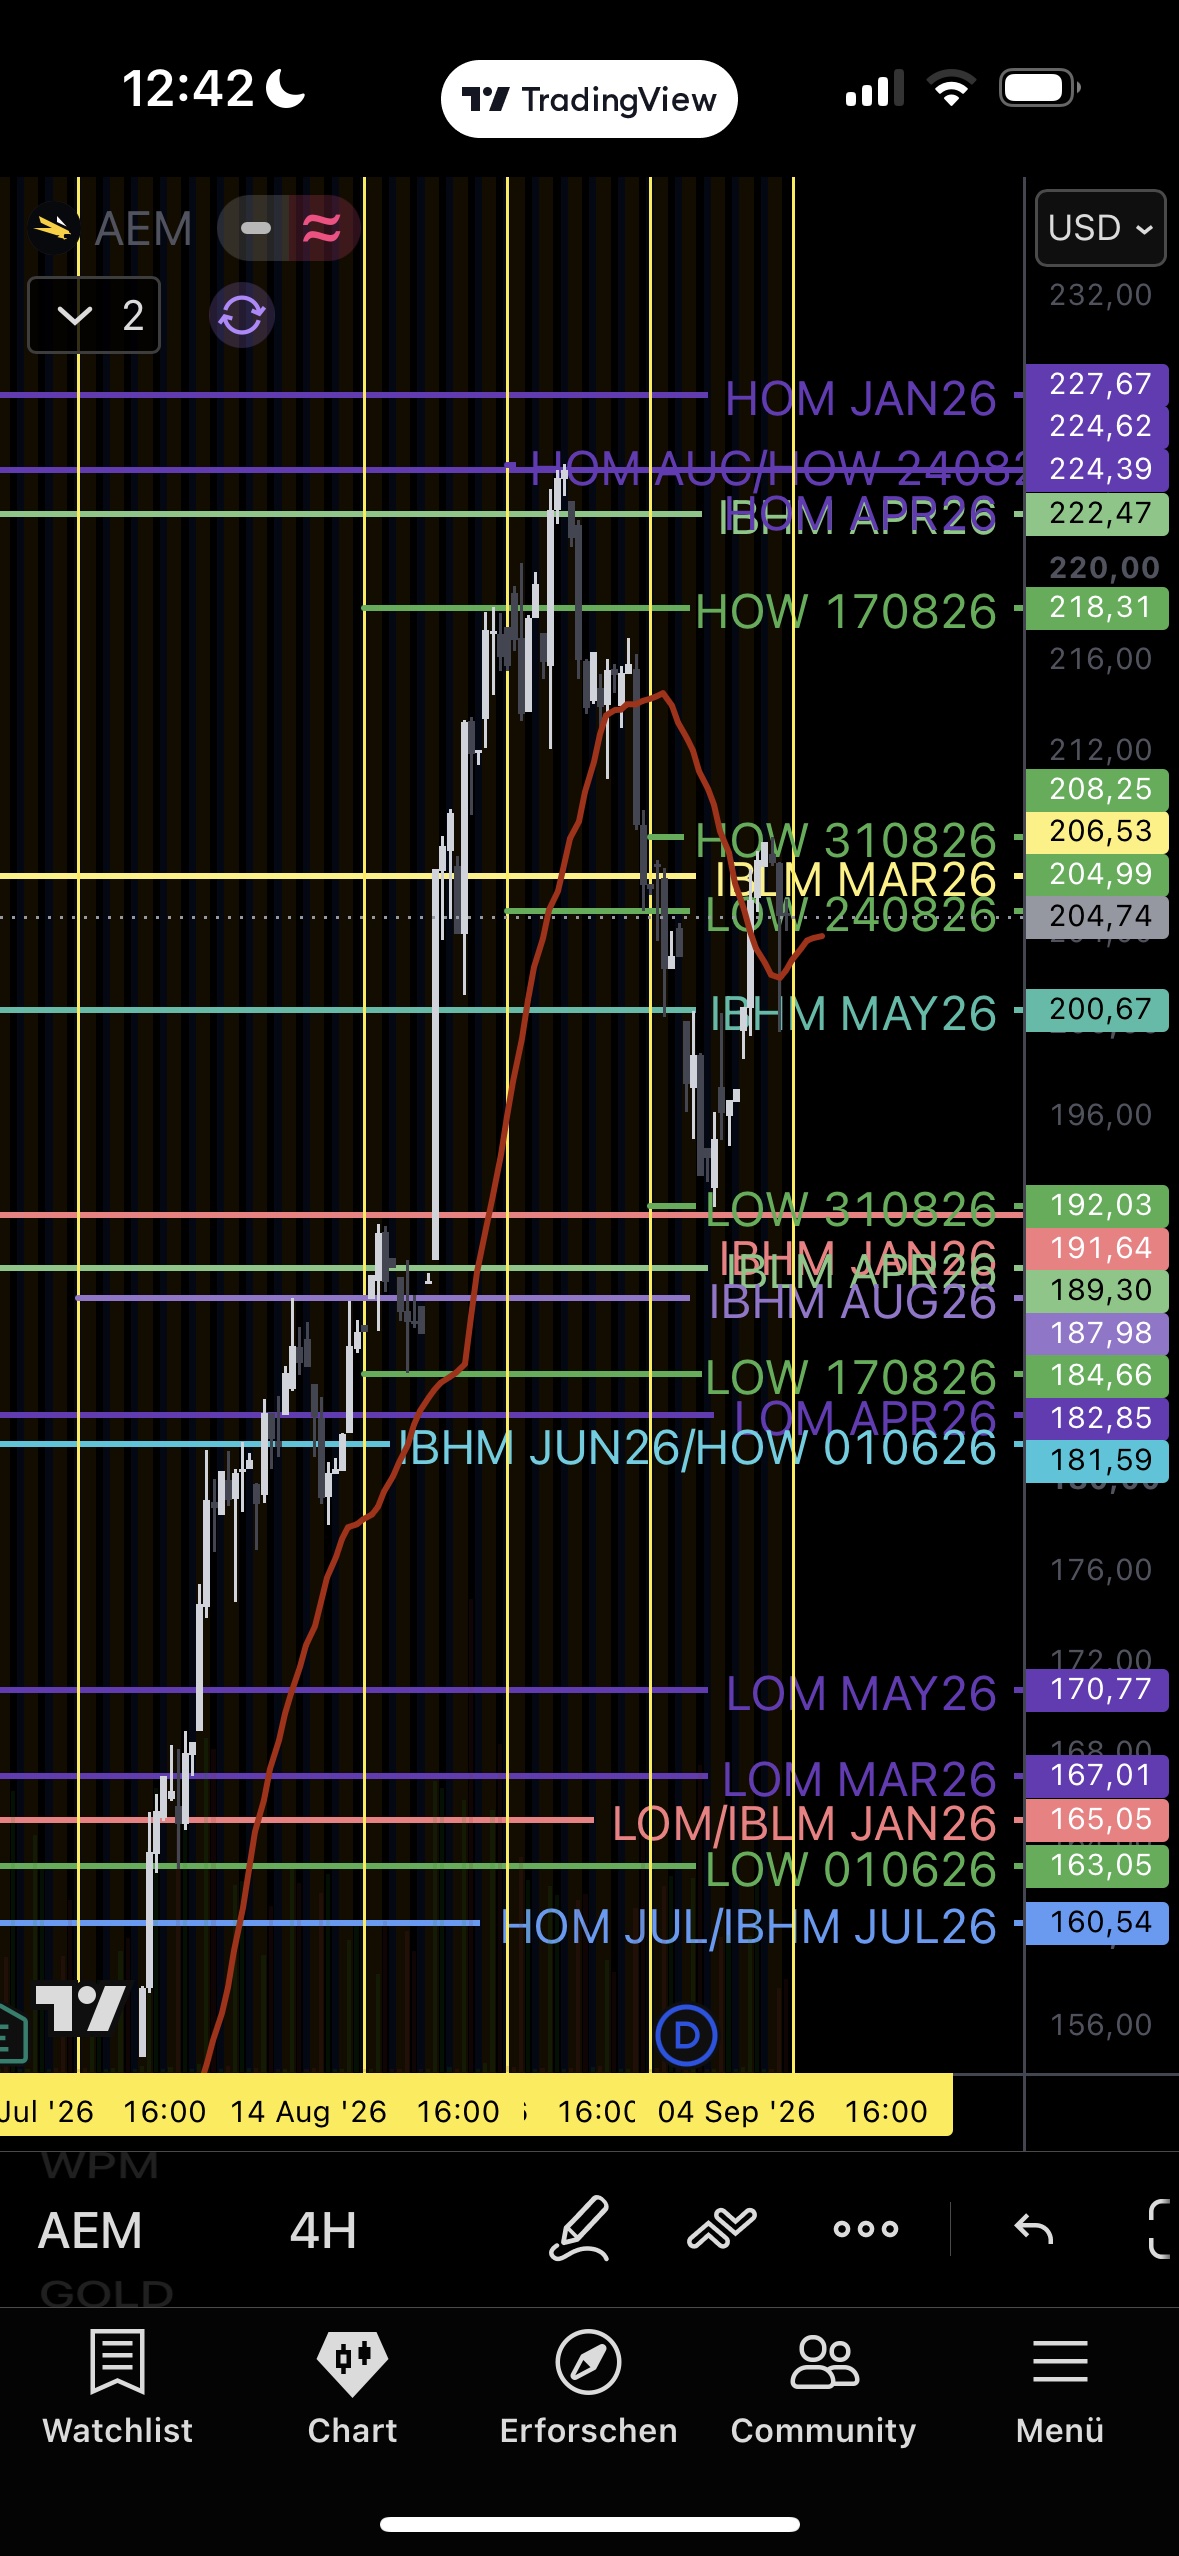
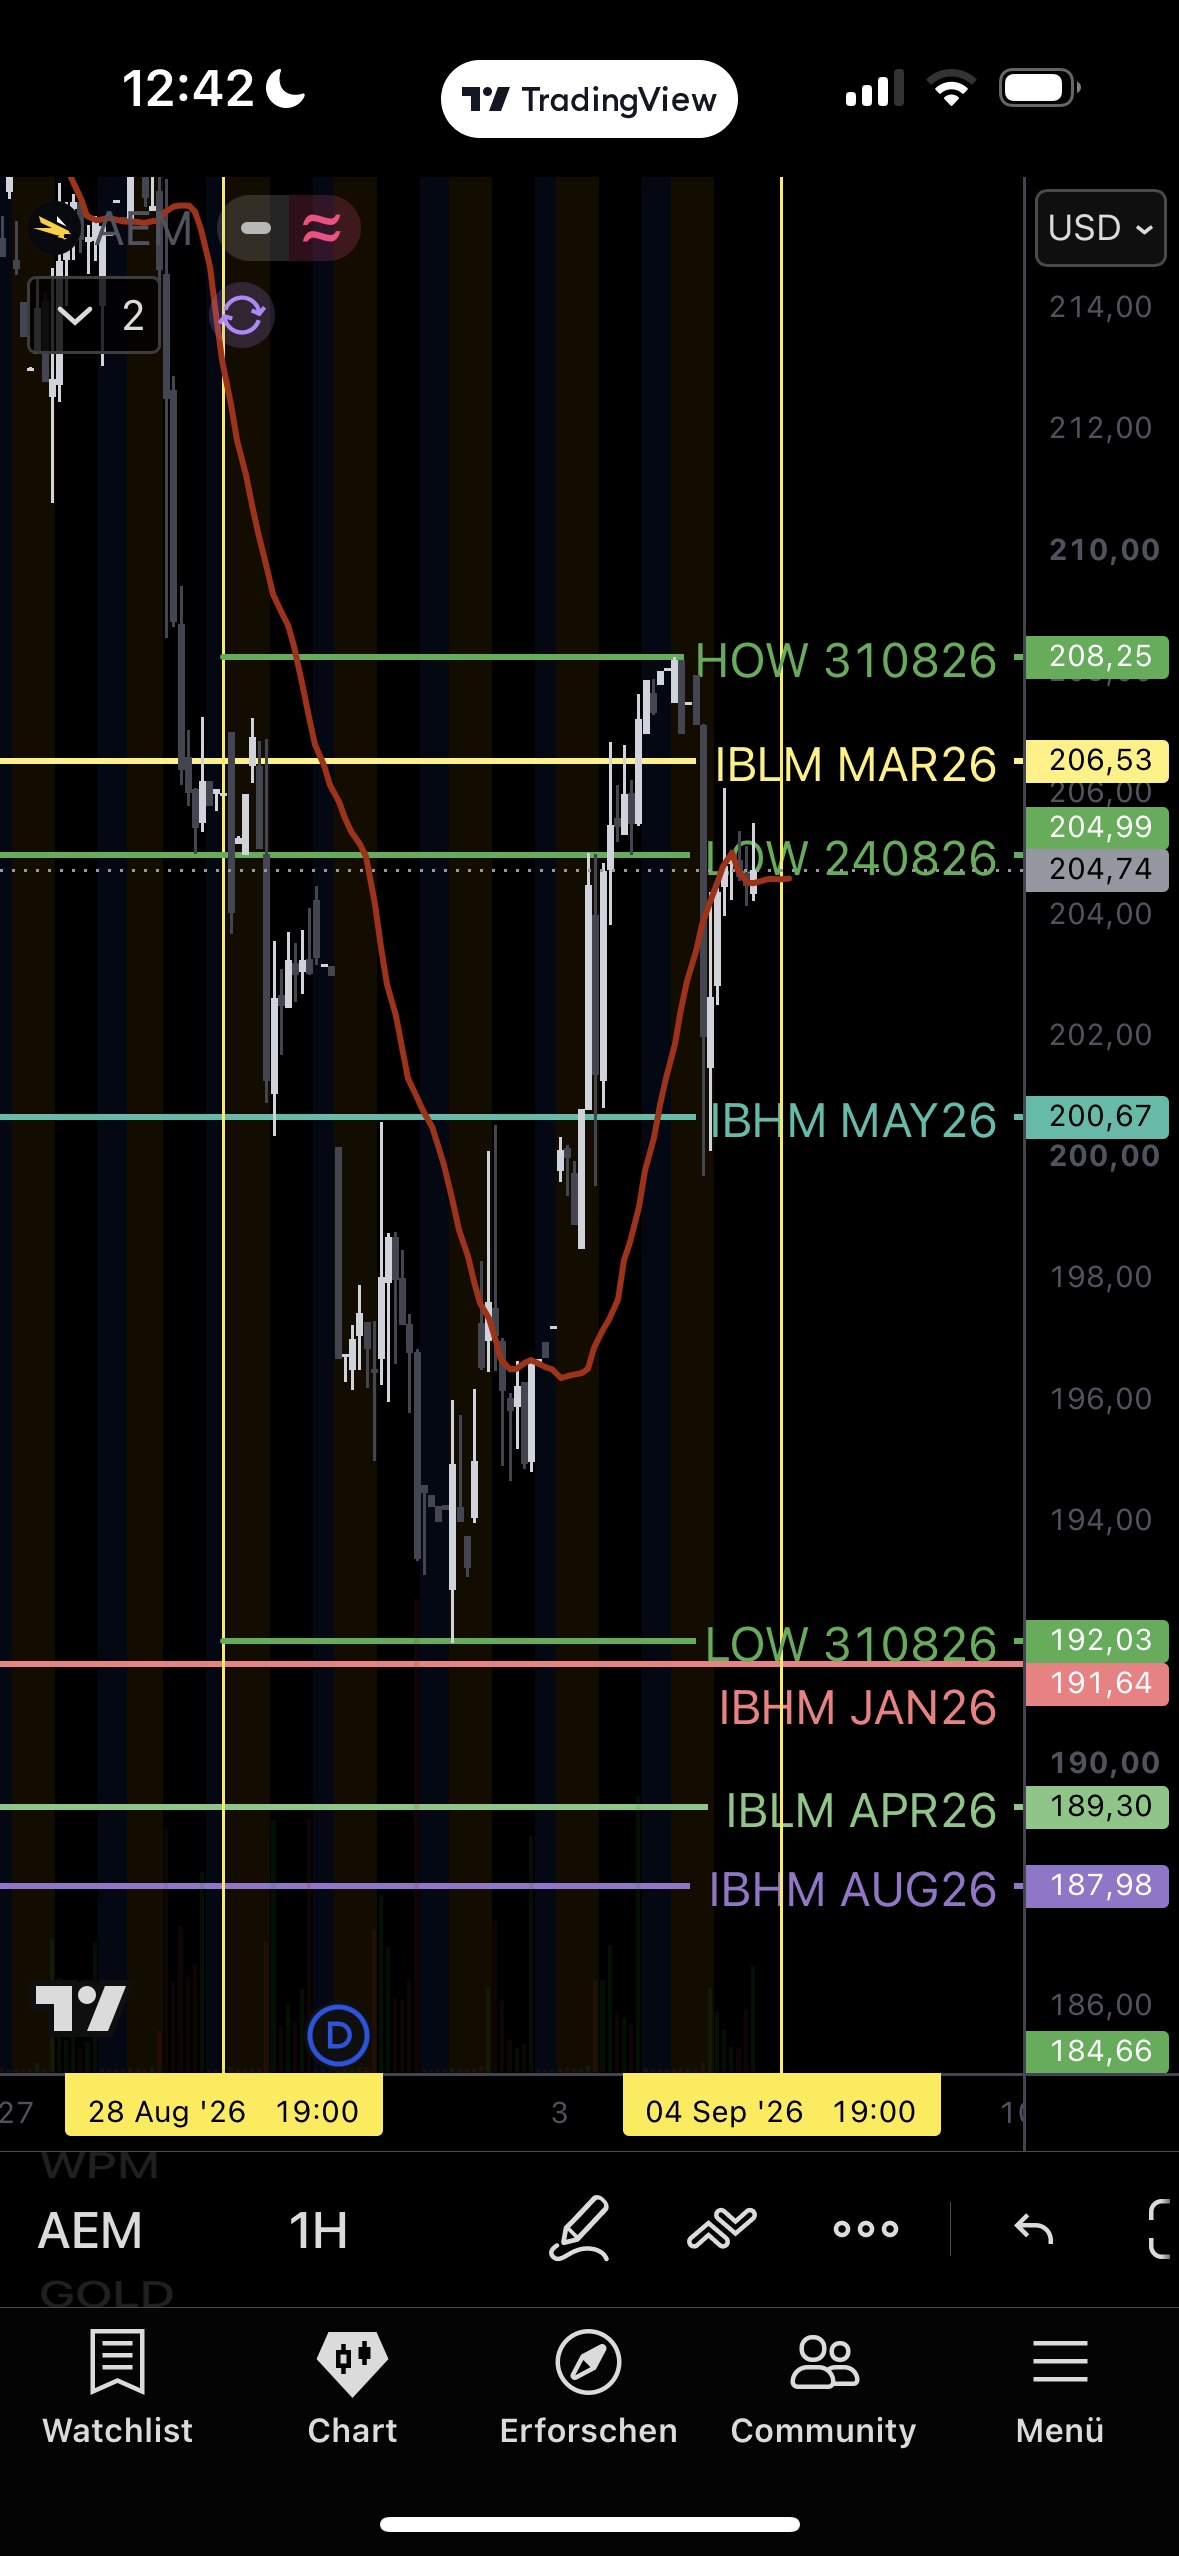
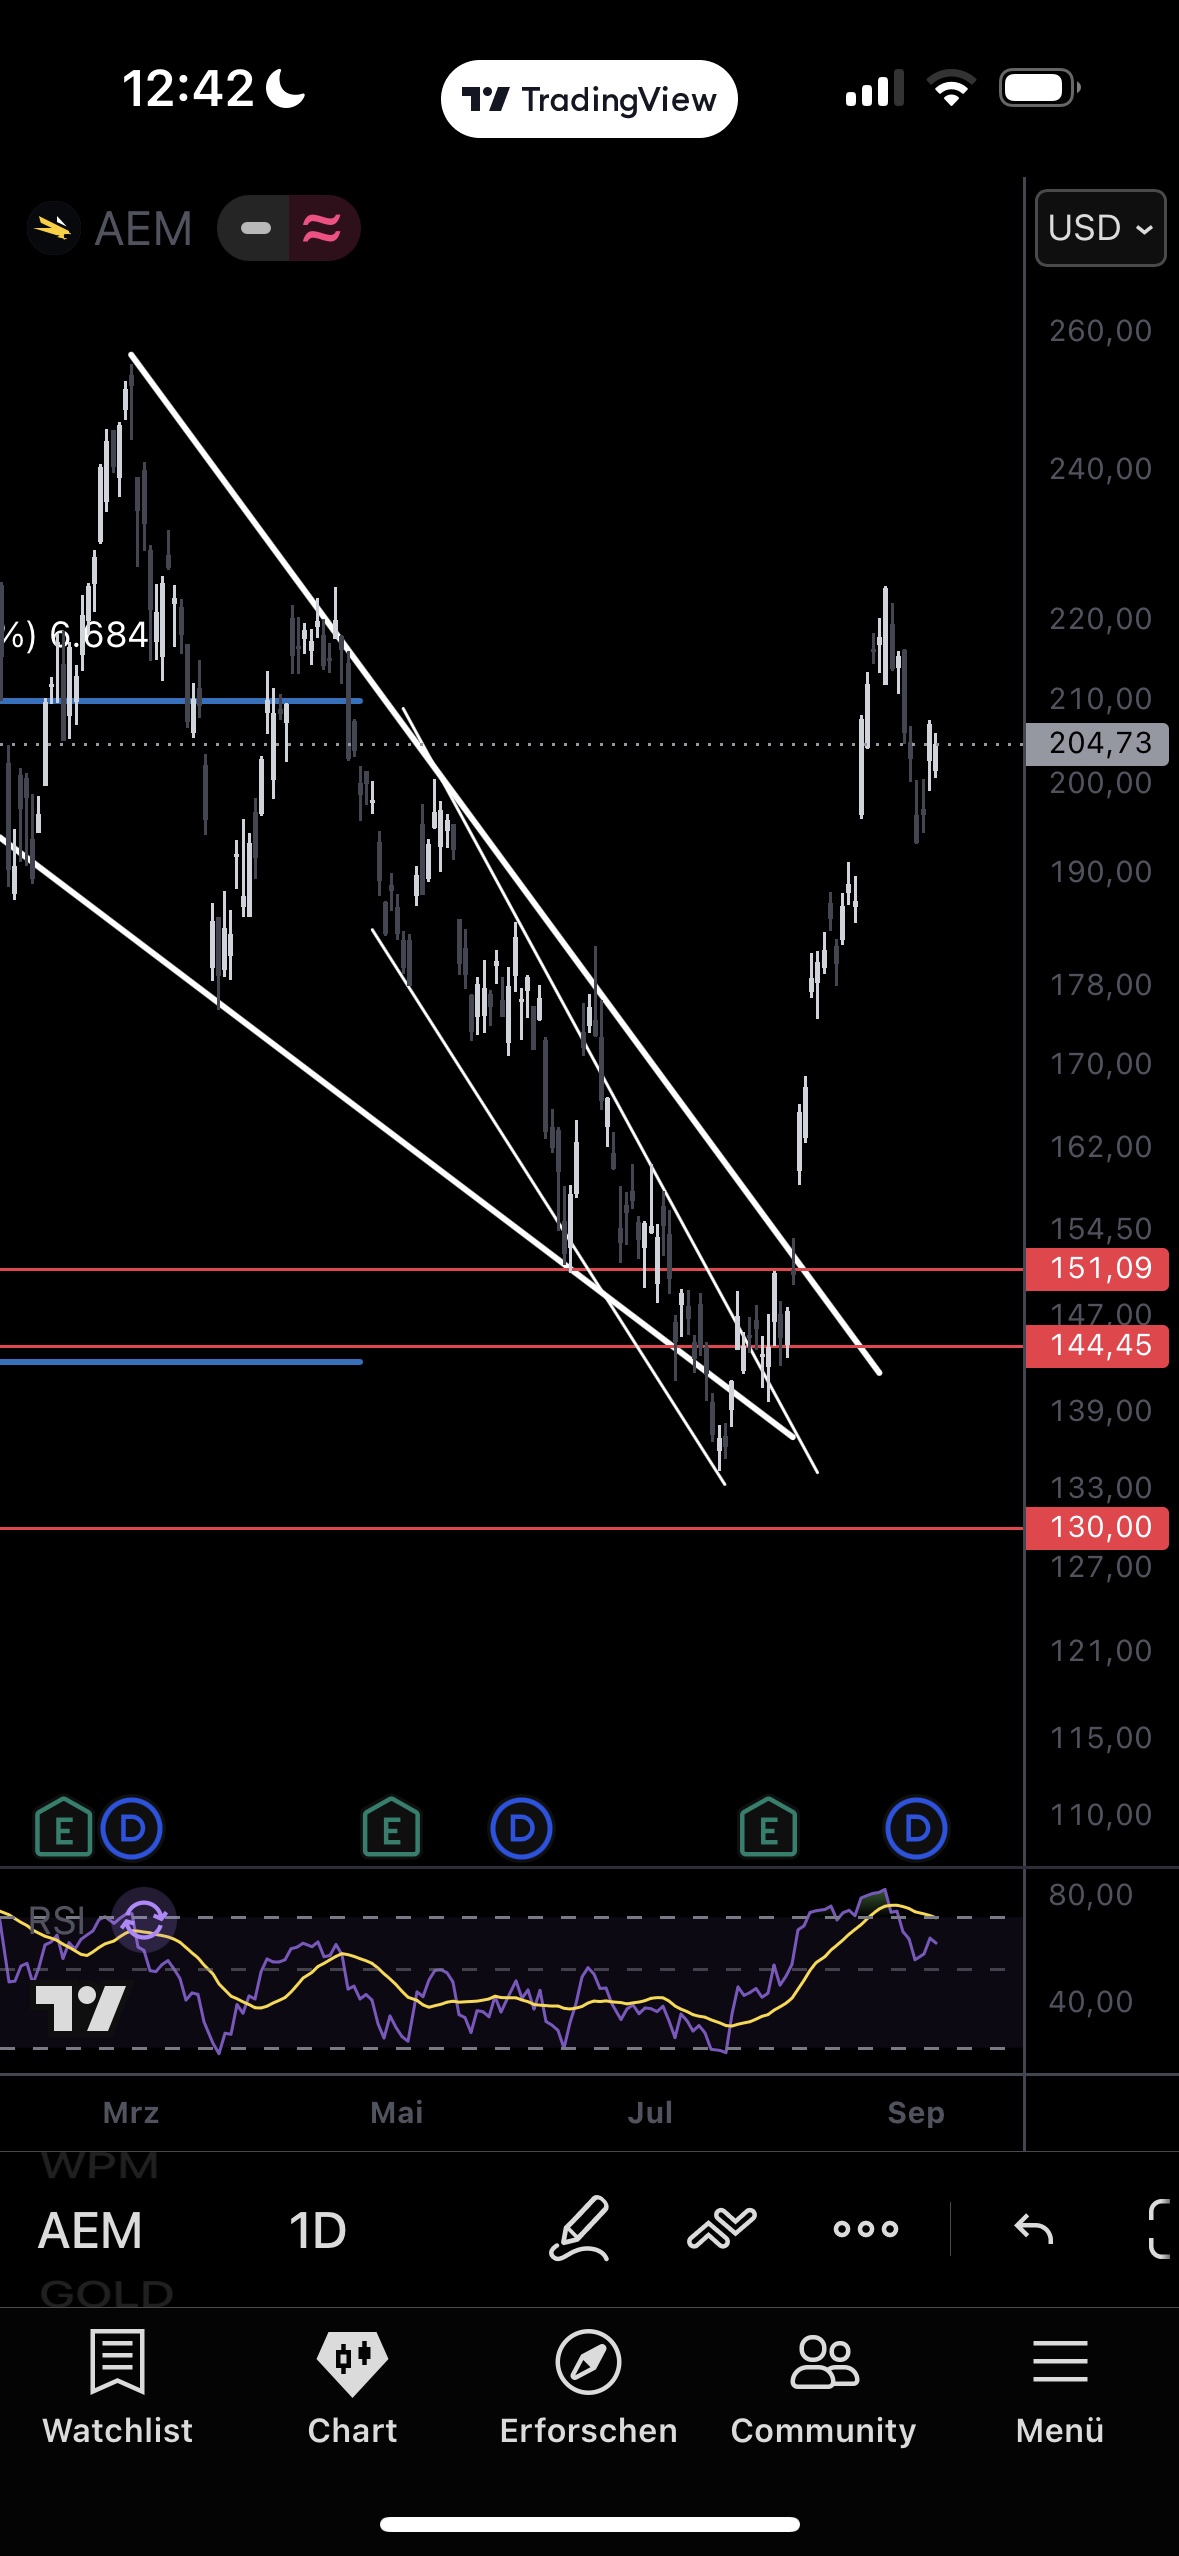
Stabilisation confirmed: from the 224.62 high a sell-off to 200.67 (IBHM MAY26), a clear V-low there, sharp recovery to 208.25, then a second smaller consolidation with a 204.74 low right at the 204.99/206.53 cluster. A close above 206.53/208.25 → continuation toward 218 and new highs; a renewed test or break of 200.67 would be the warning sign. The 130→224 impulse is not damaged — a first healthy digestion phase after the parabolic leg. JUN27 210C/260C unchanged, "unchanged until levels are defined" in the exit plan.
Wheaton: balancing at a high level.
1D
4H
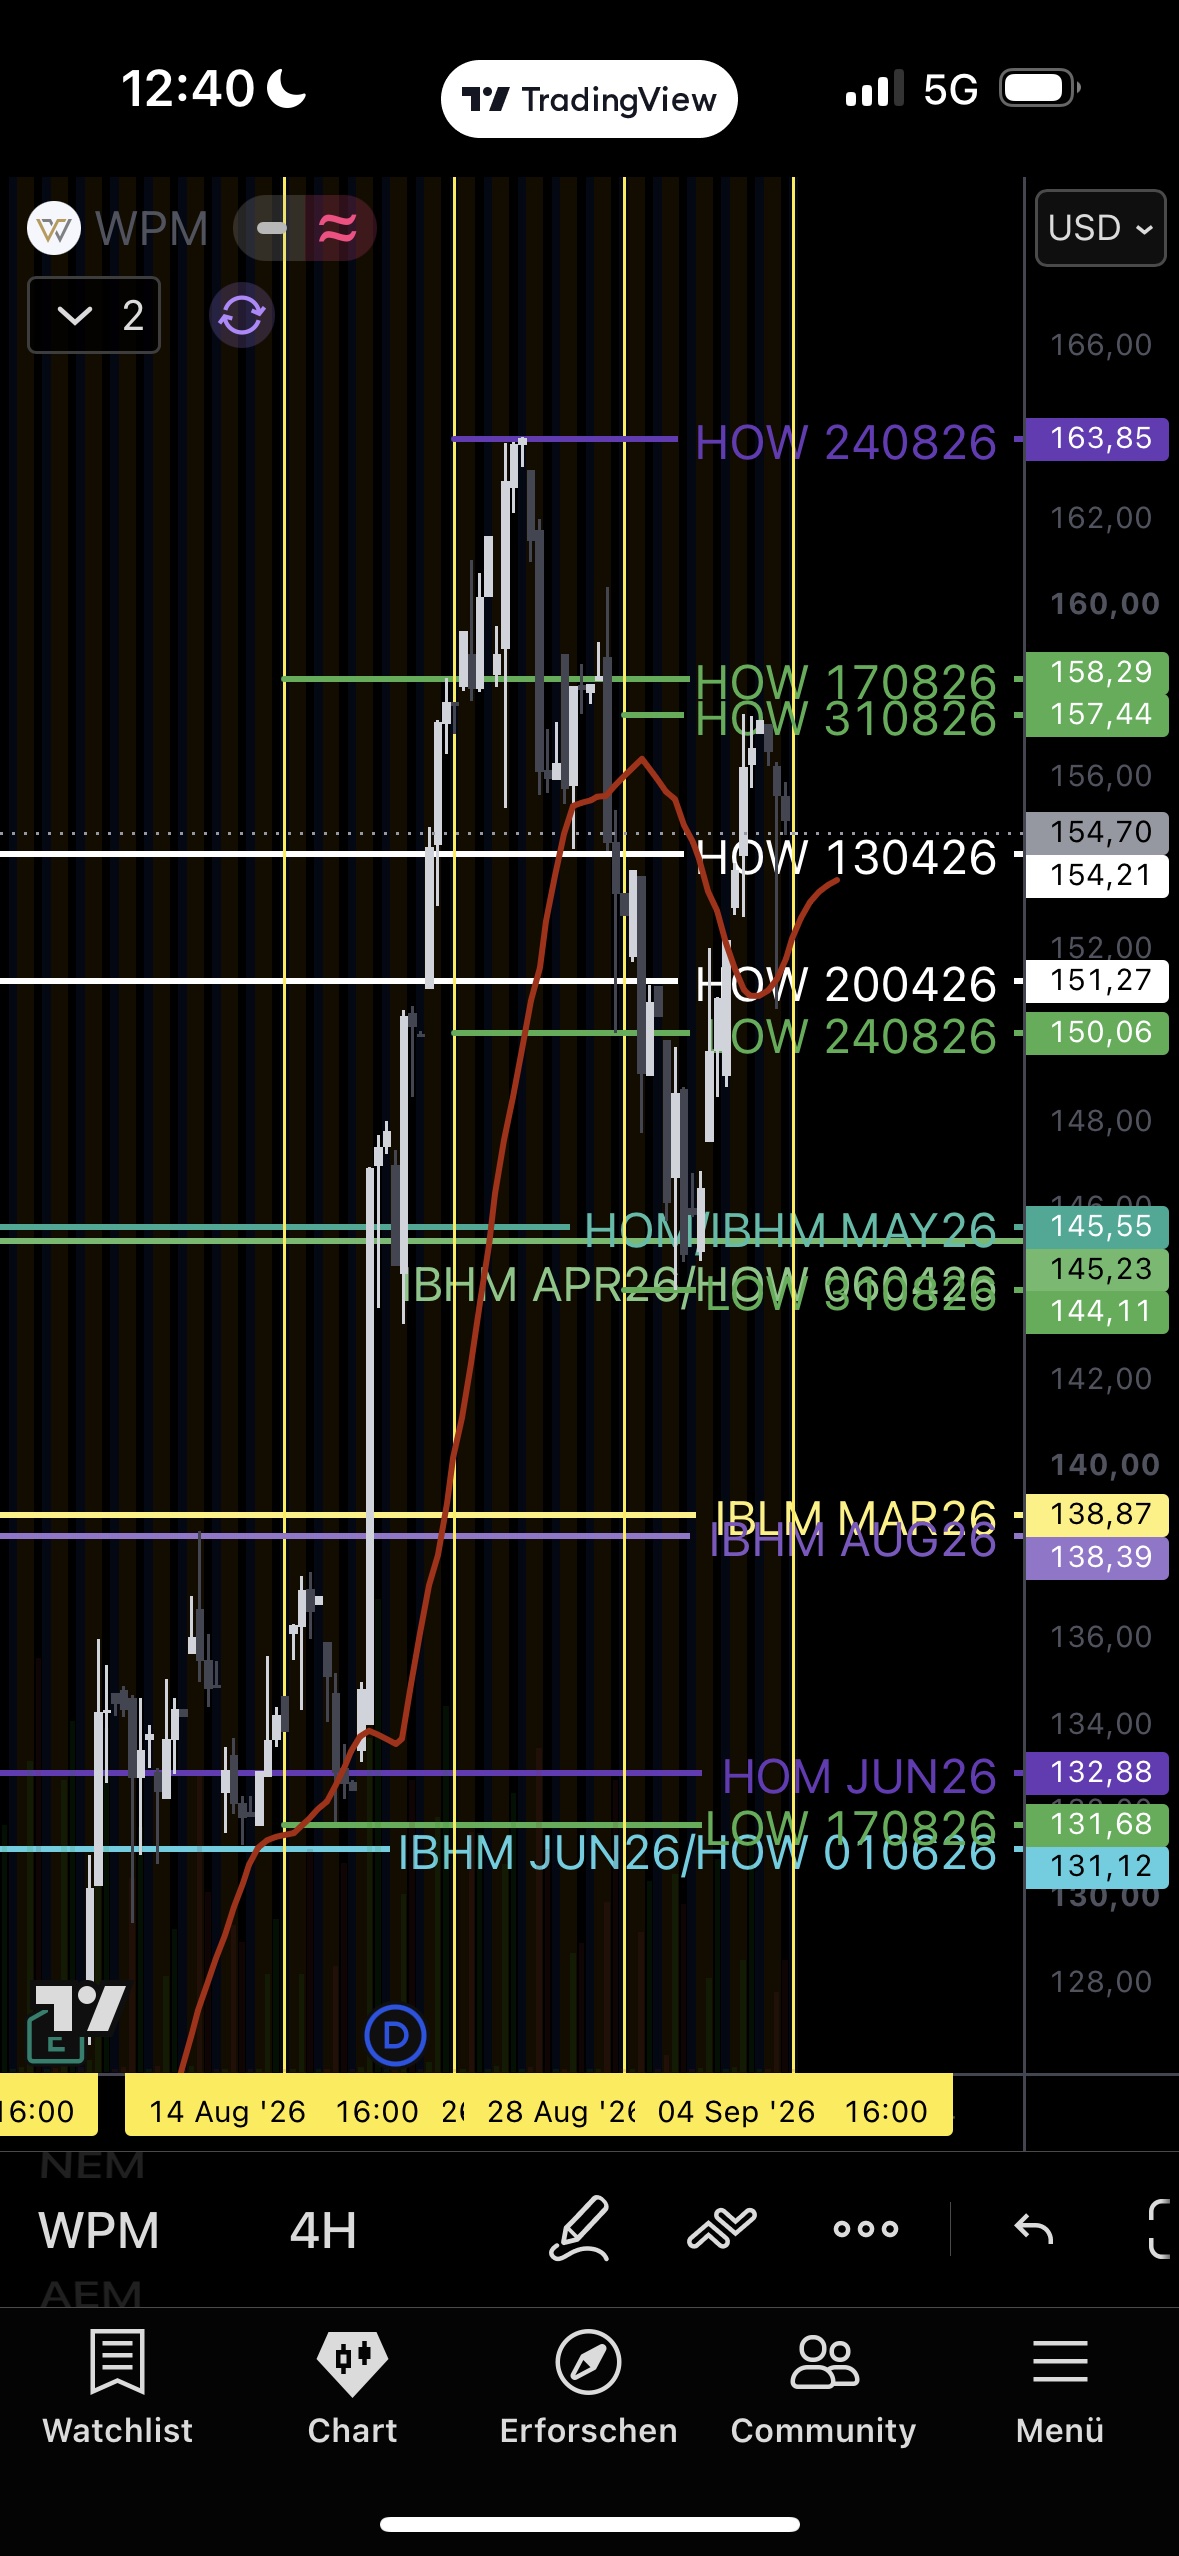
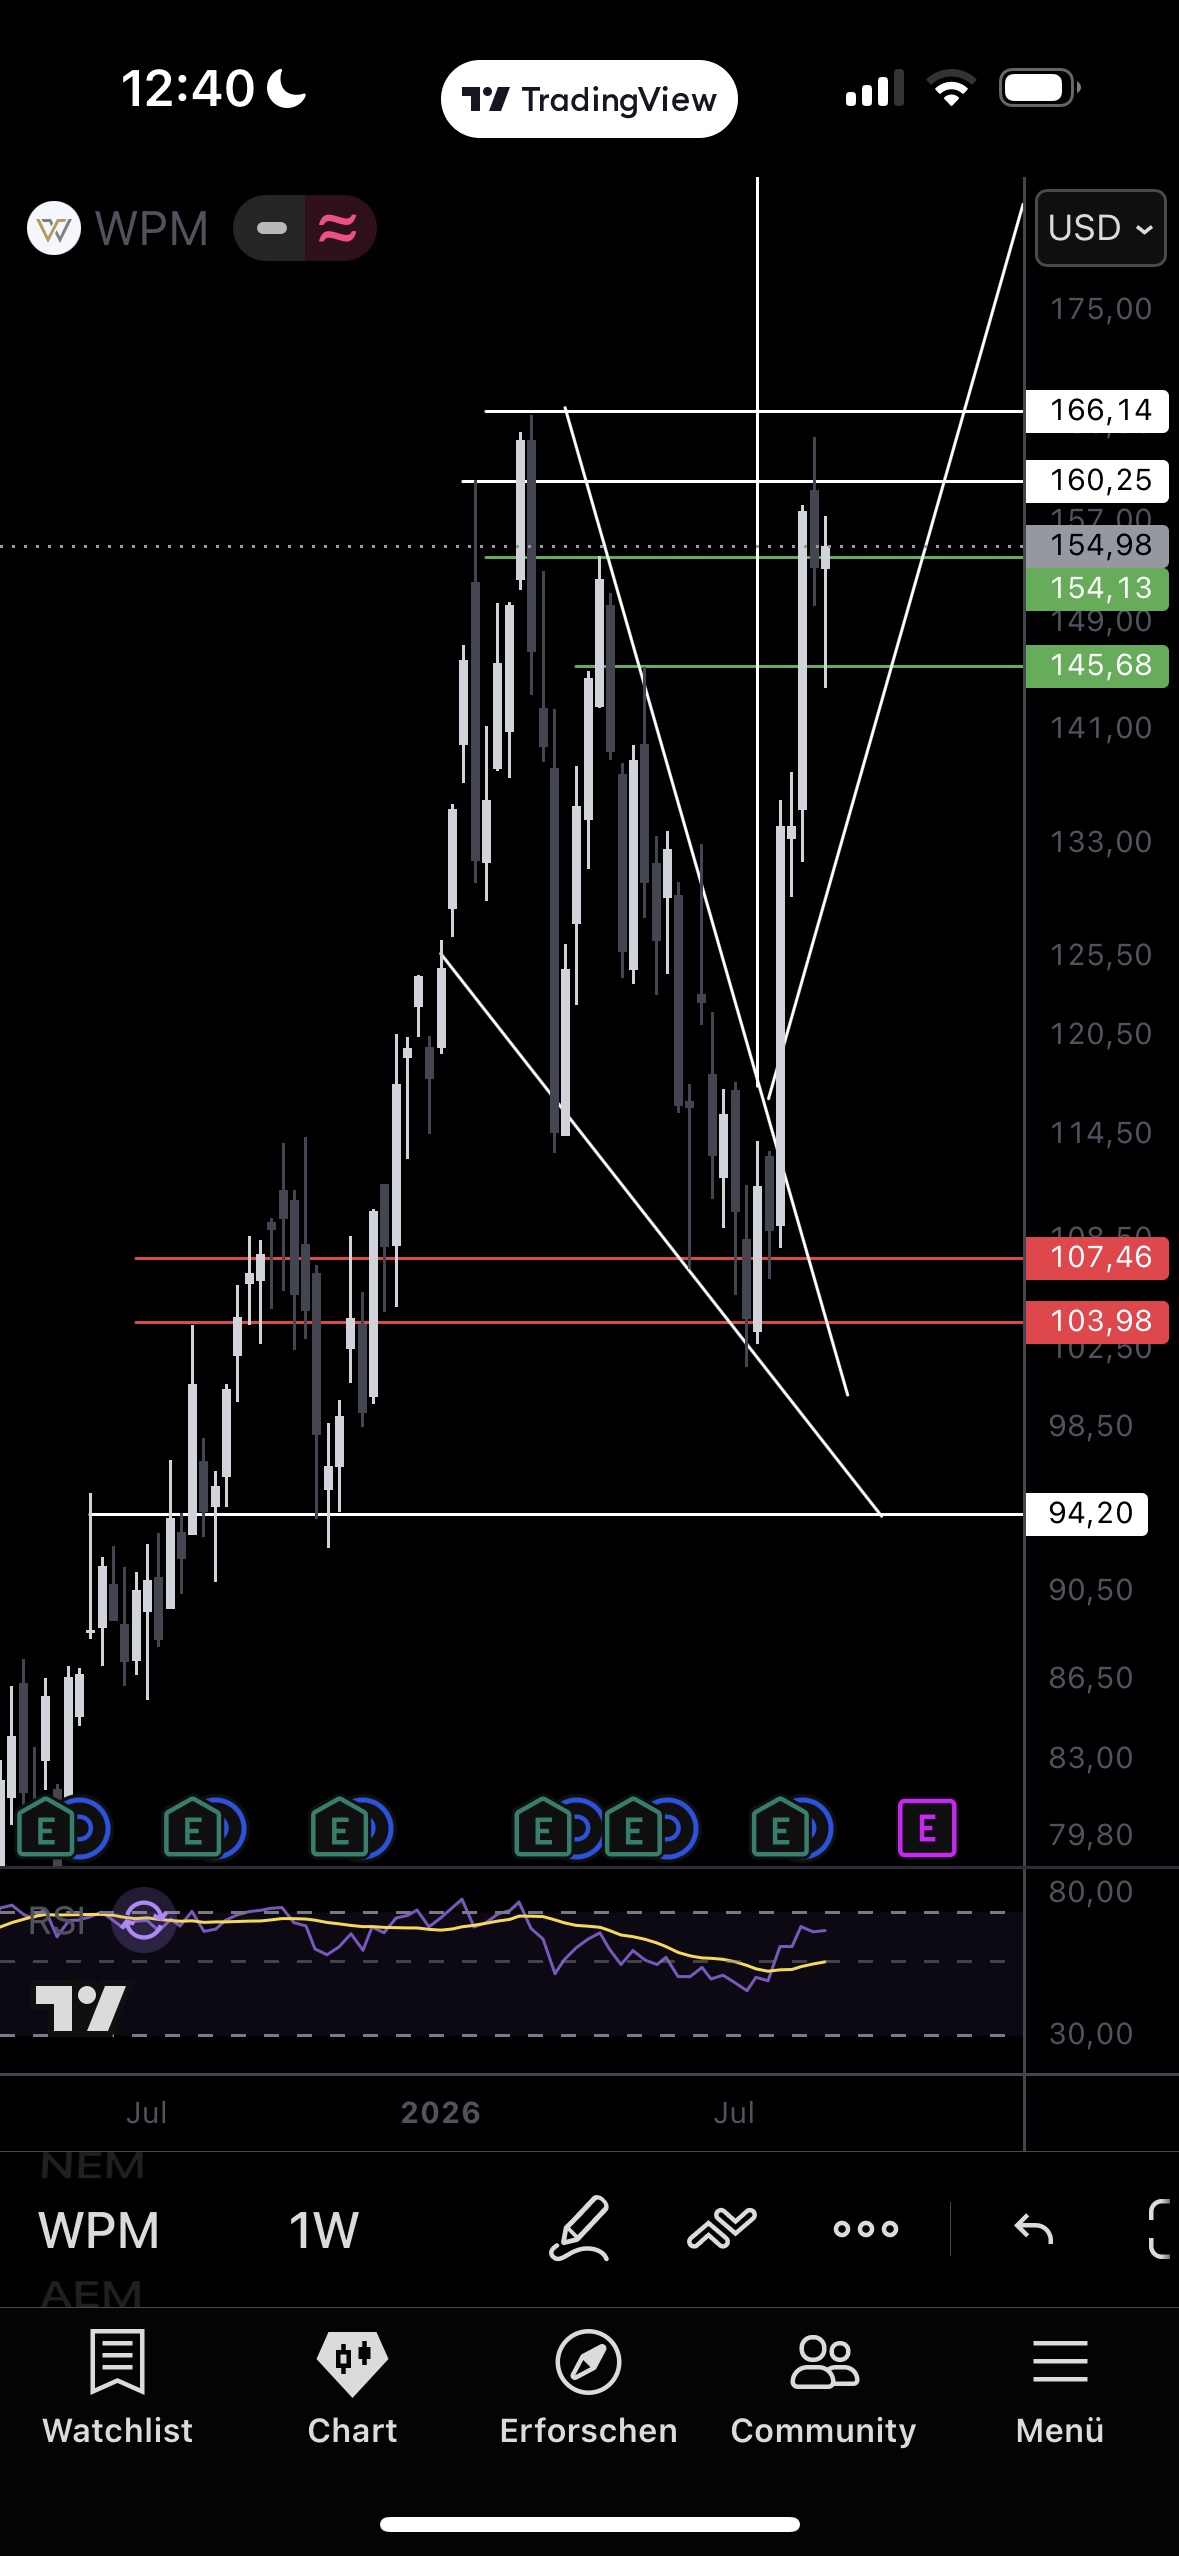
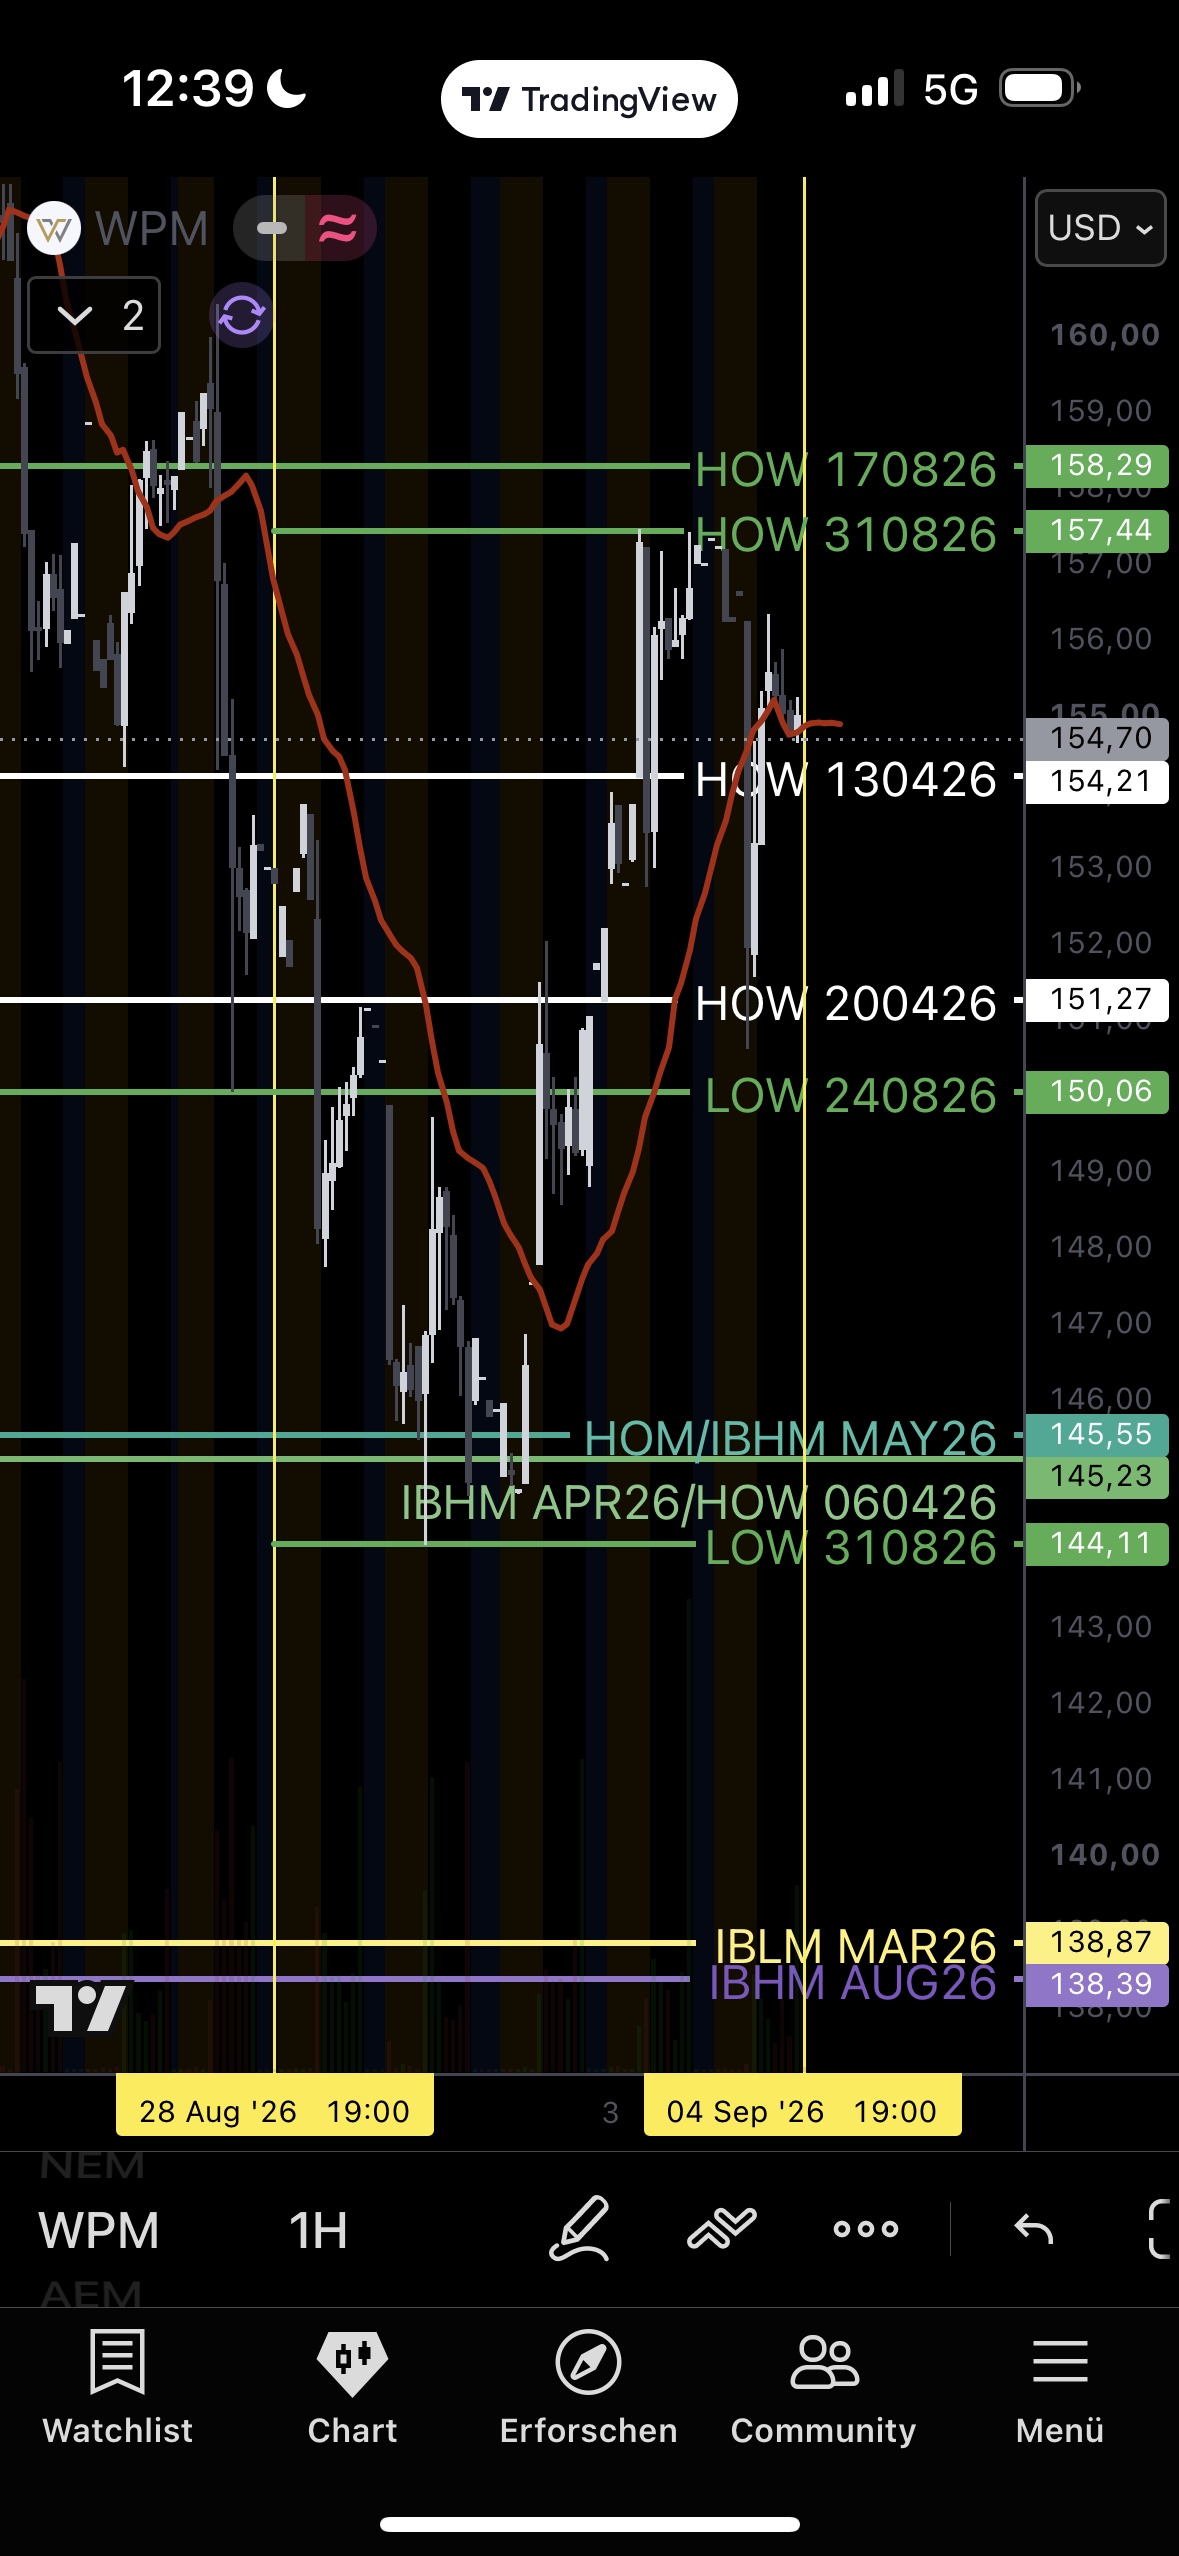
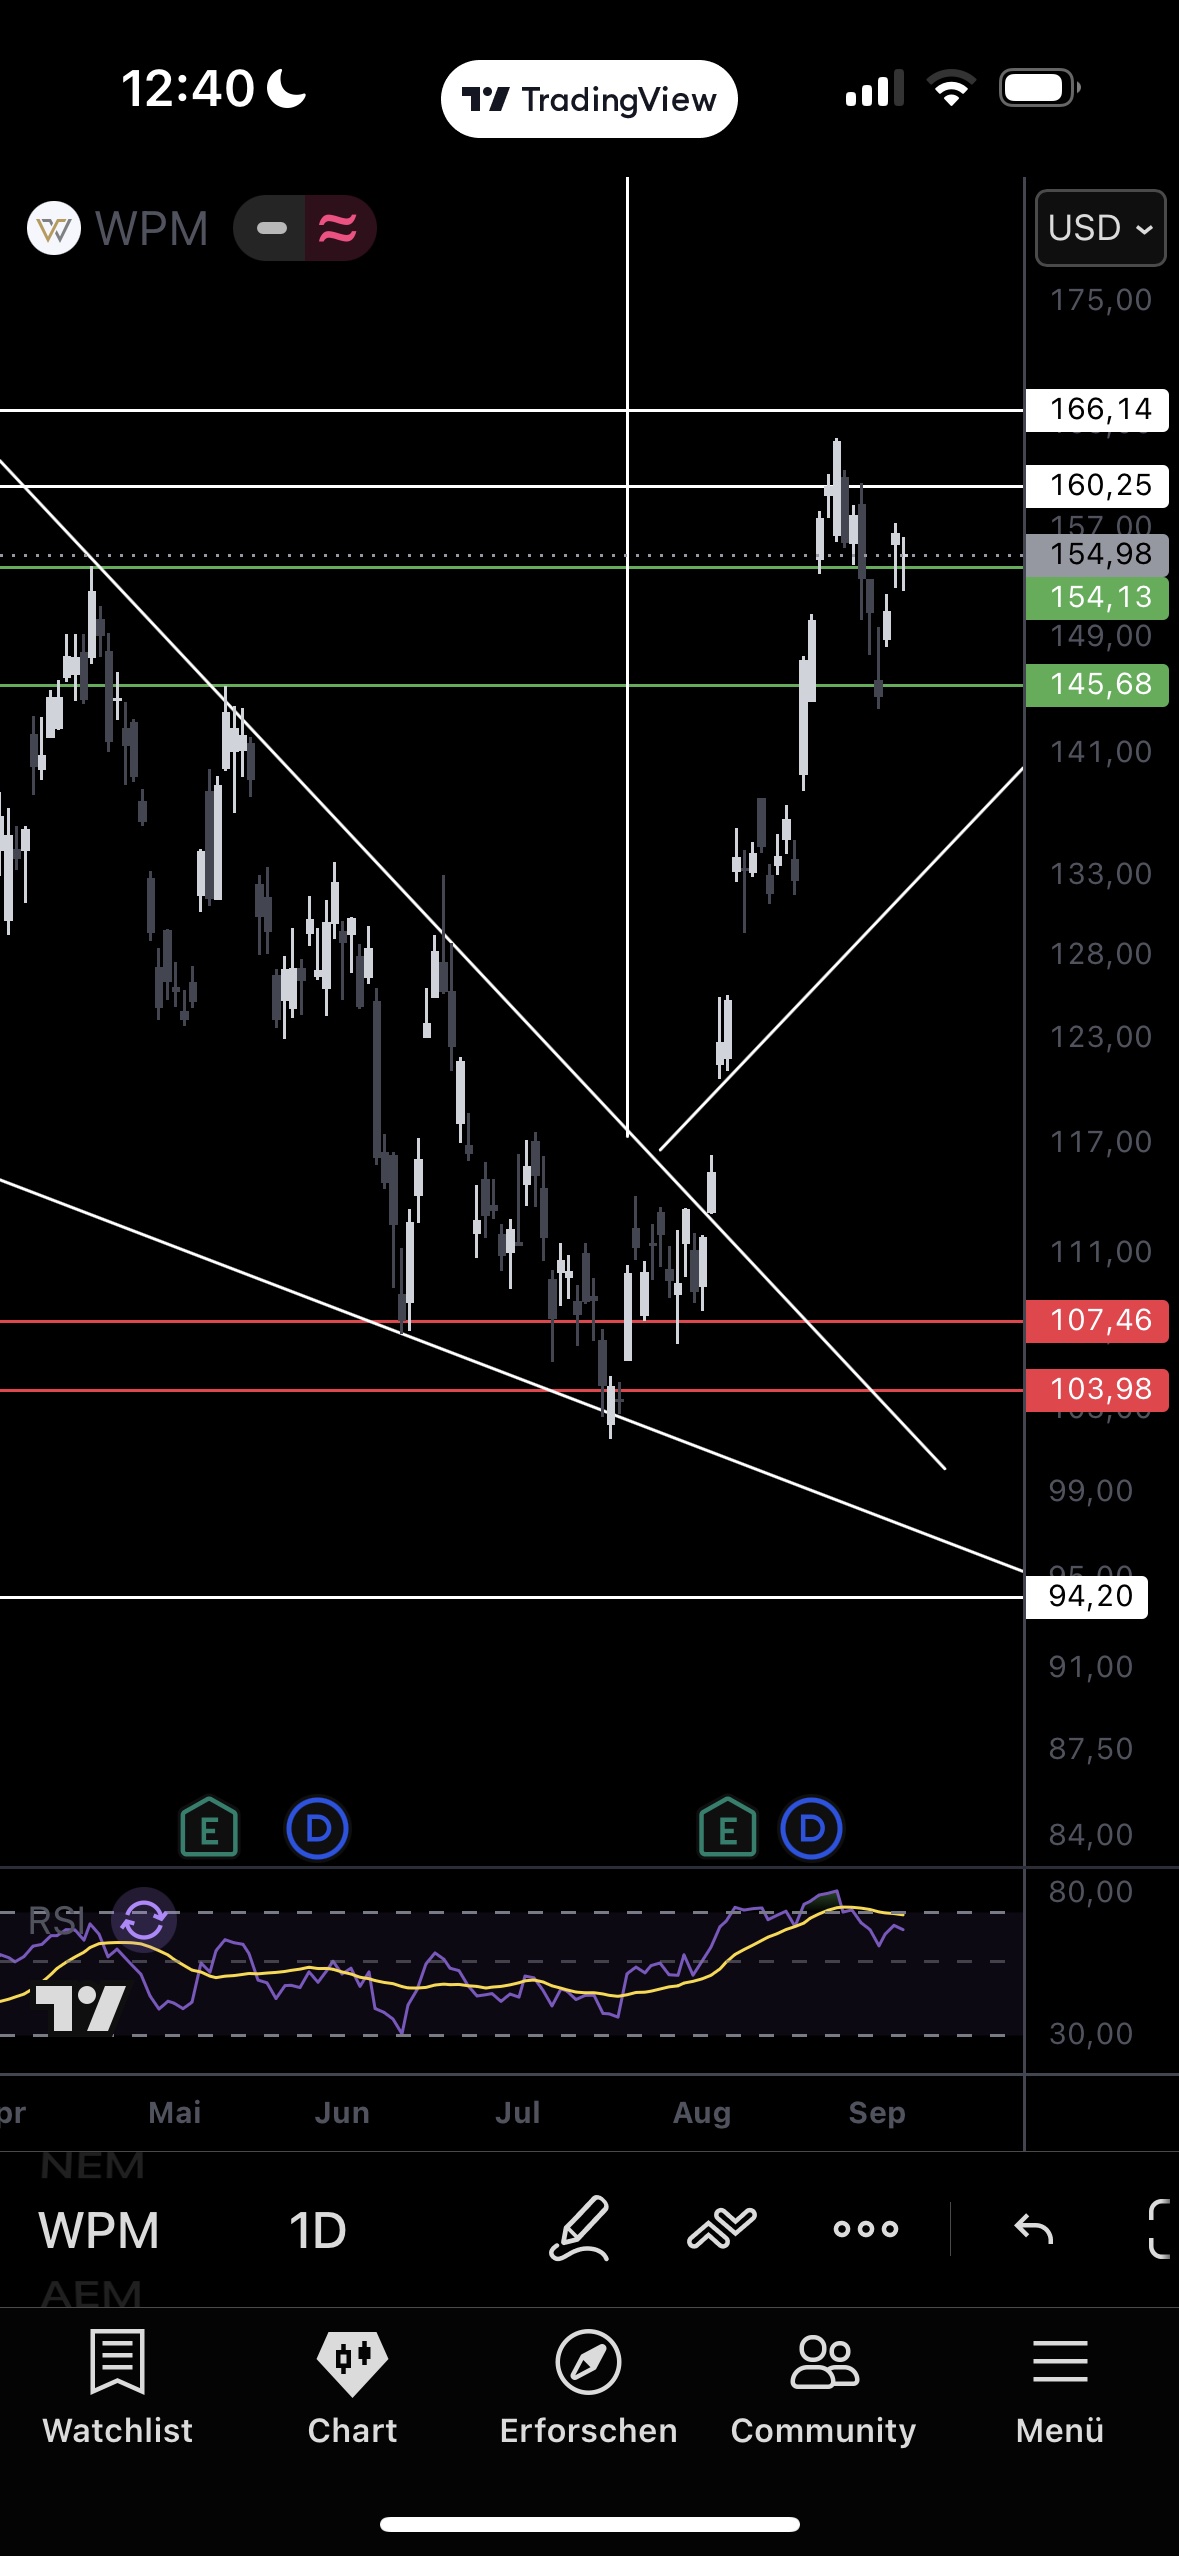
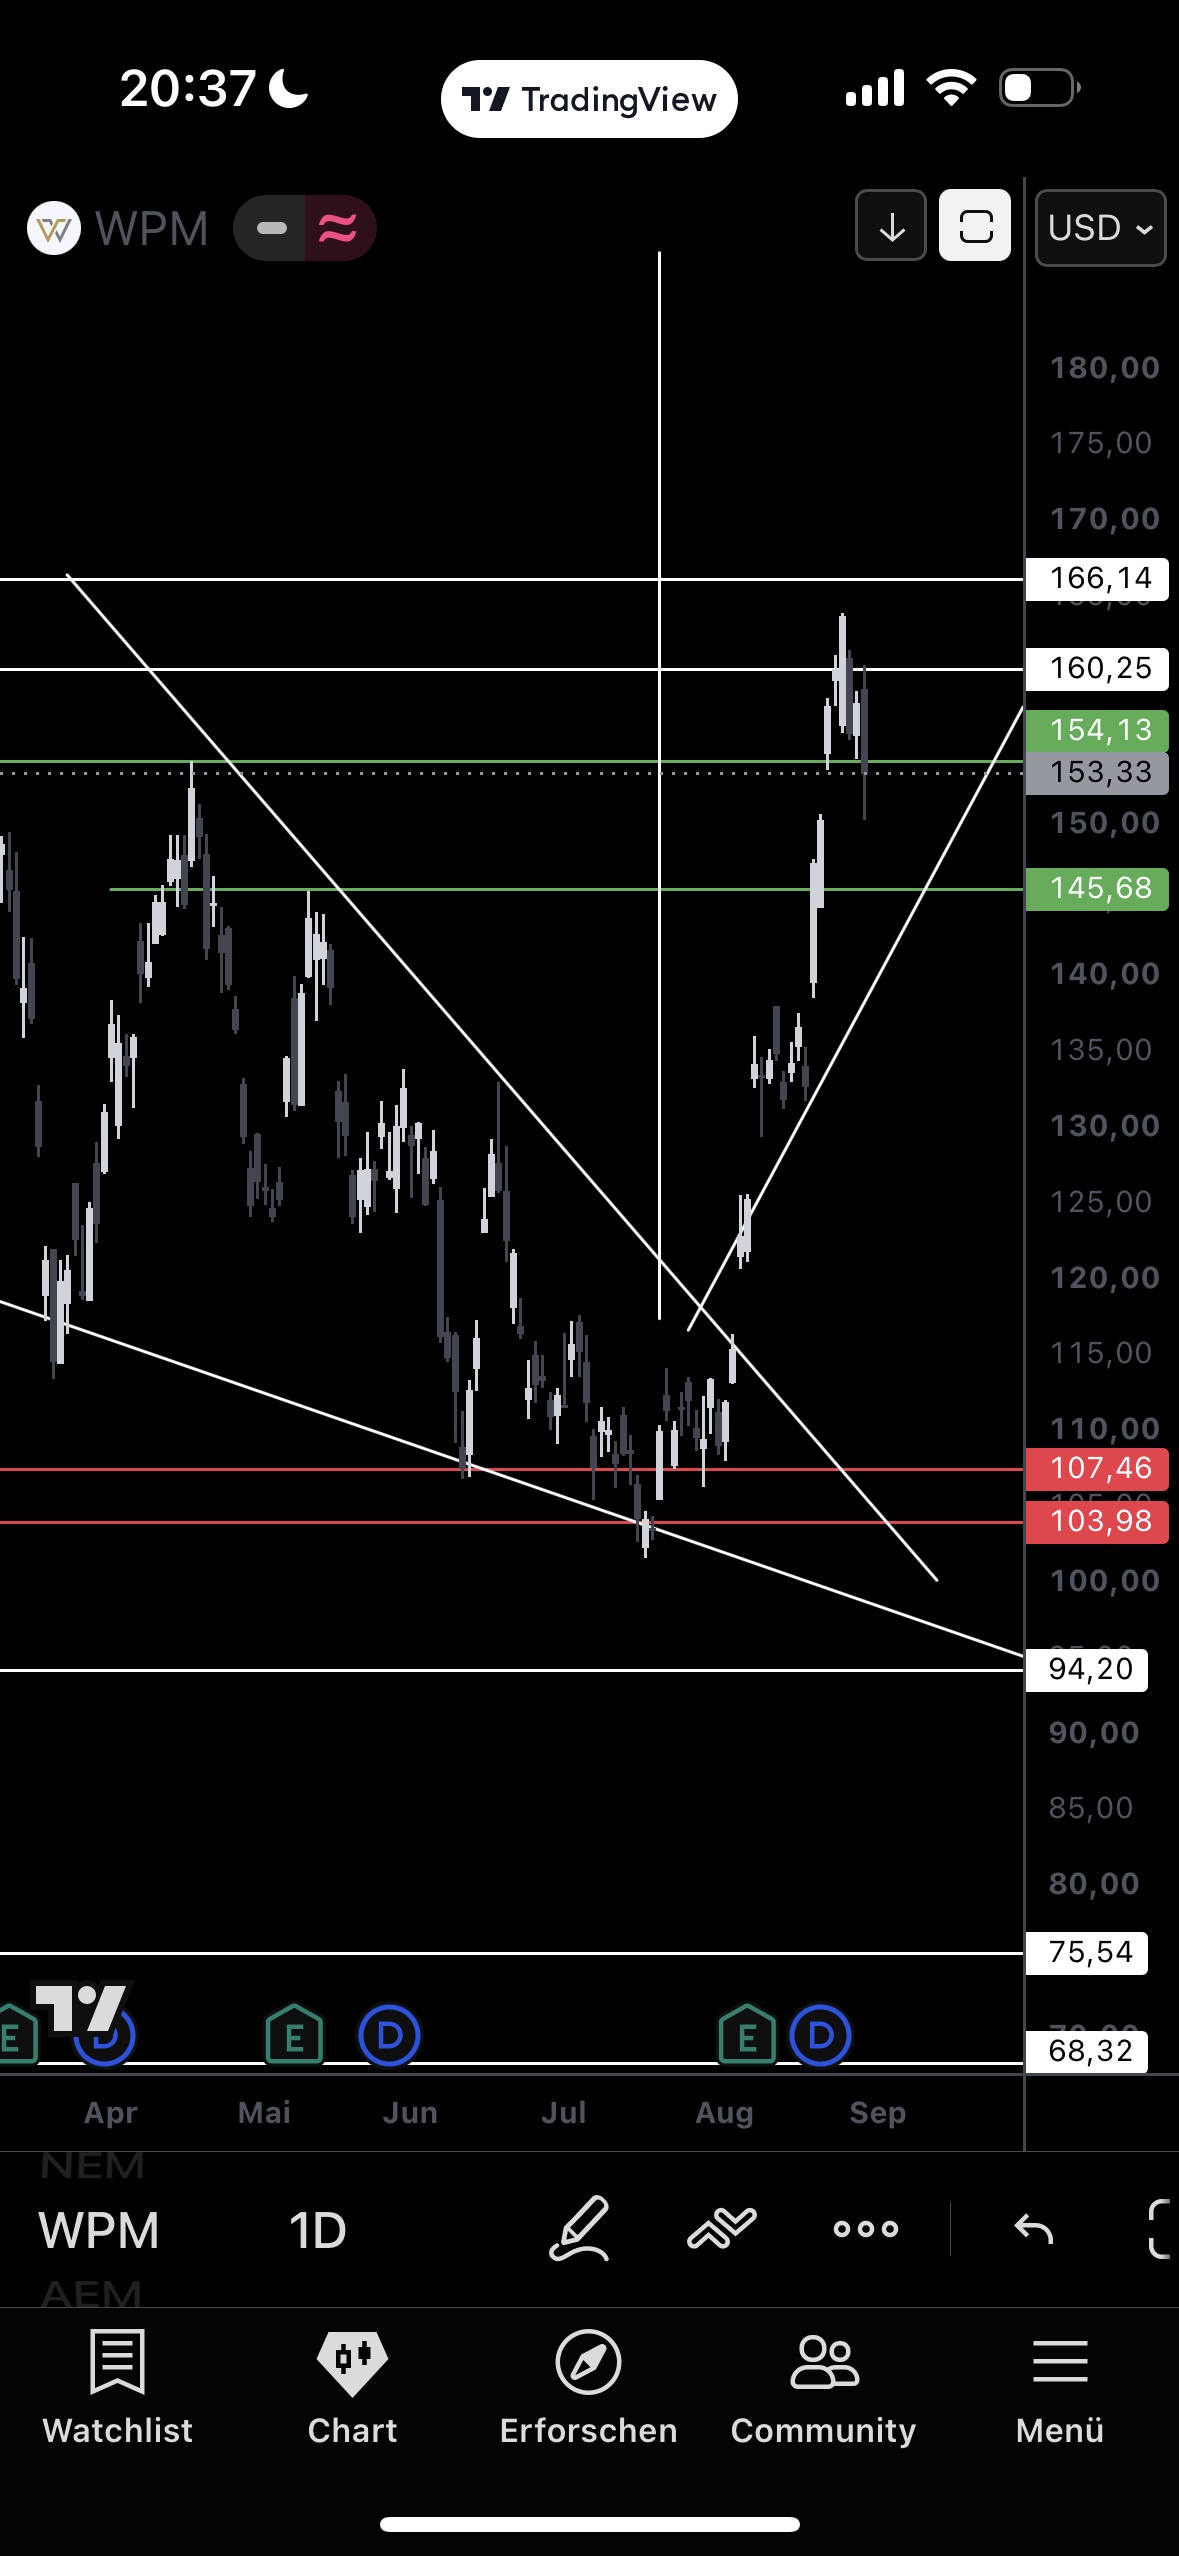
After the pullback (low 144.11) another push to 157.44, consolidating just below 158.29 and 154.21 — the second round in the new 144–164 range. Two multi-day consolidations at a high level without a retest of the old breakout zone (117.96) are a sign of strength, not exhaustion. Bullish on a daily close > 158.29 with momentum → 163.85 → 166.14 (ATH). Warning sign: a break < 144.11 followed by a break of the 138.87/138.39 zone. MAR27 130C stays a full runner, not on the trim list.
Hecla: balance — and a corrected thesis.
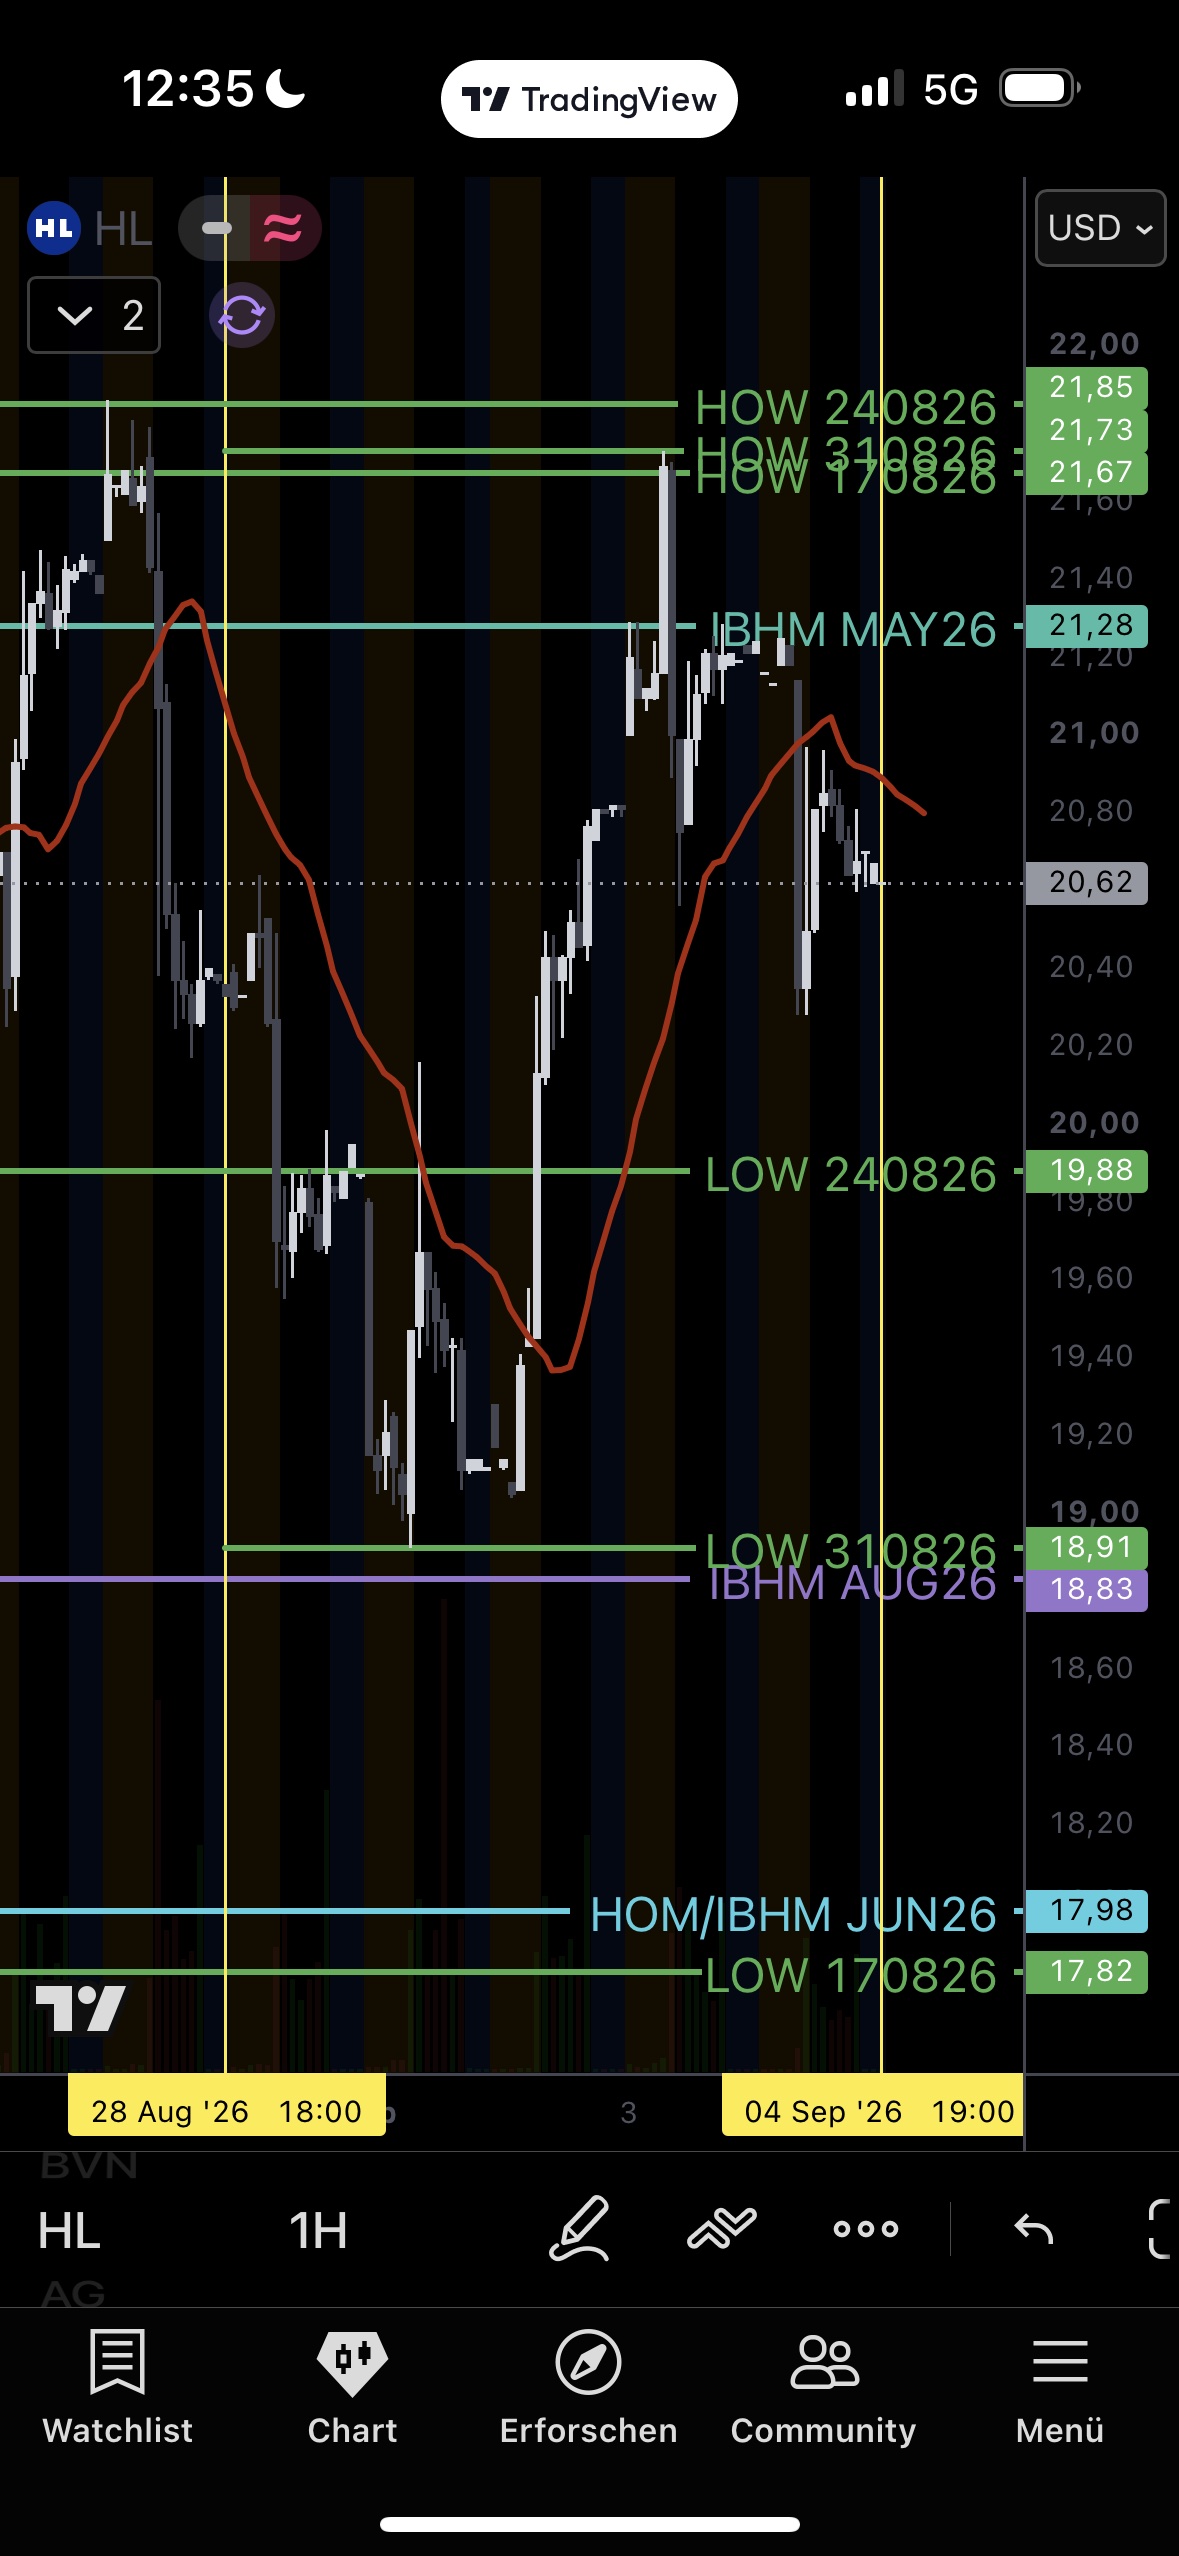
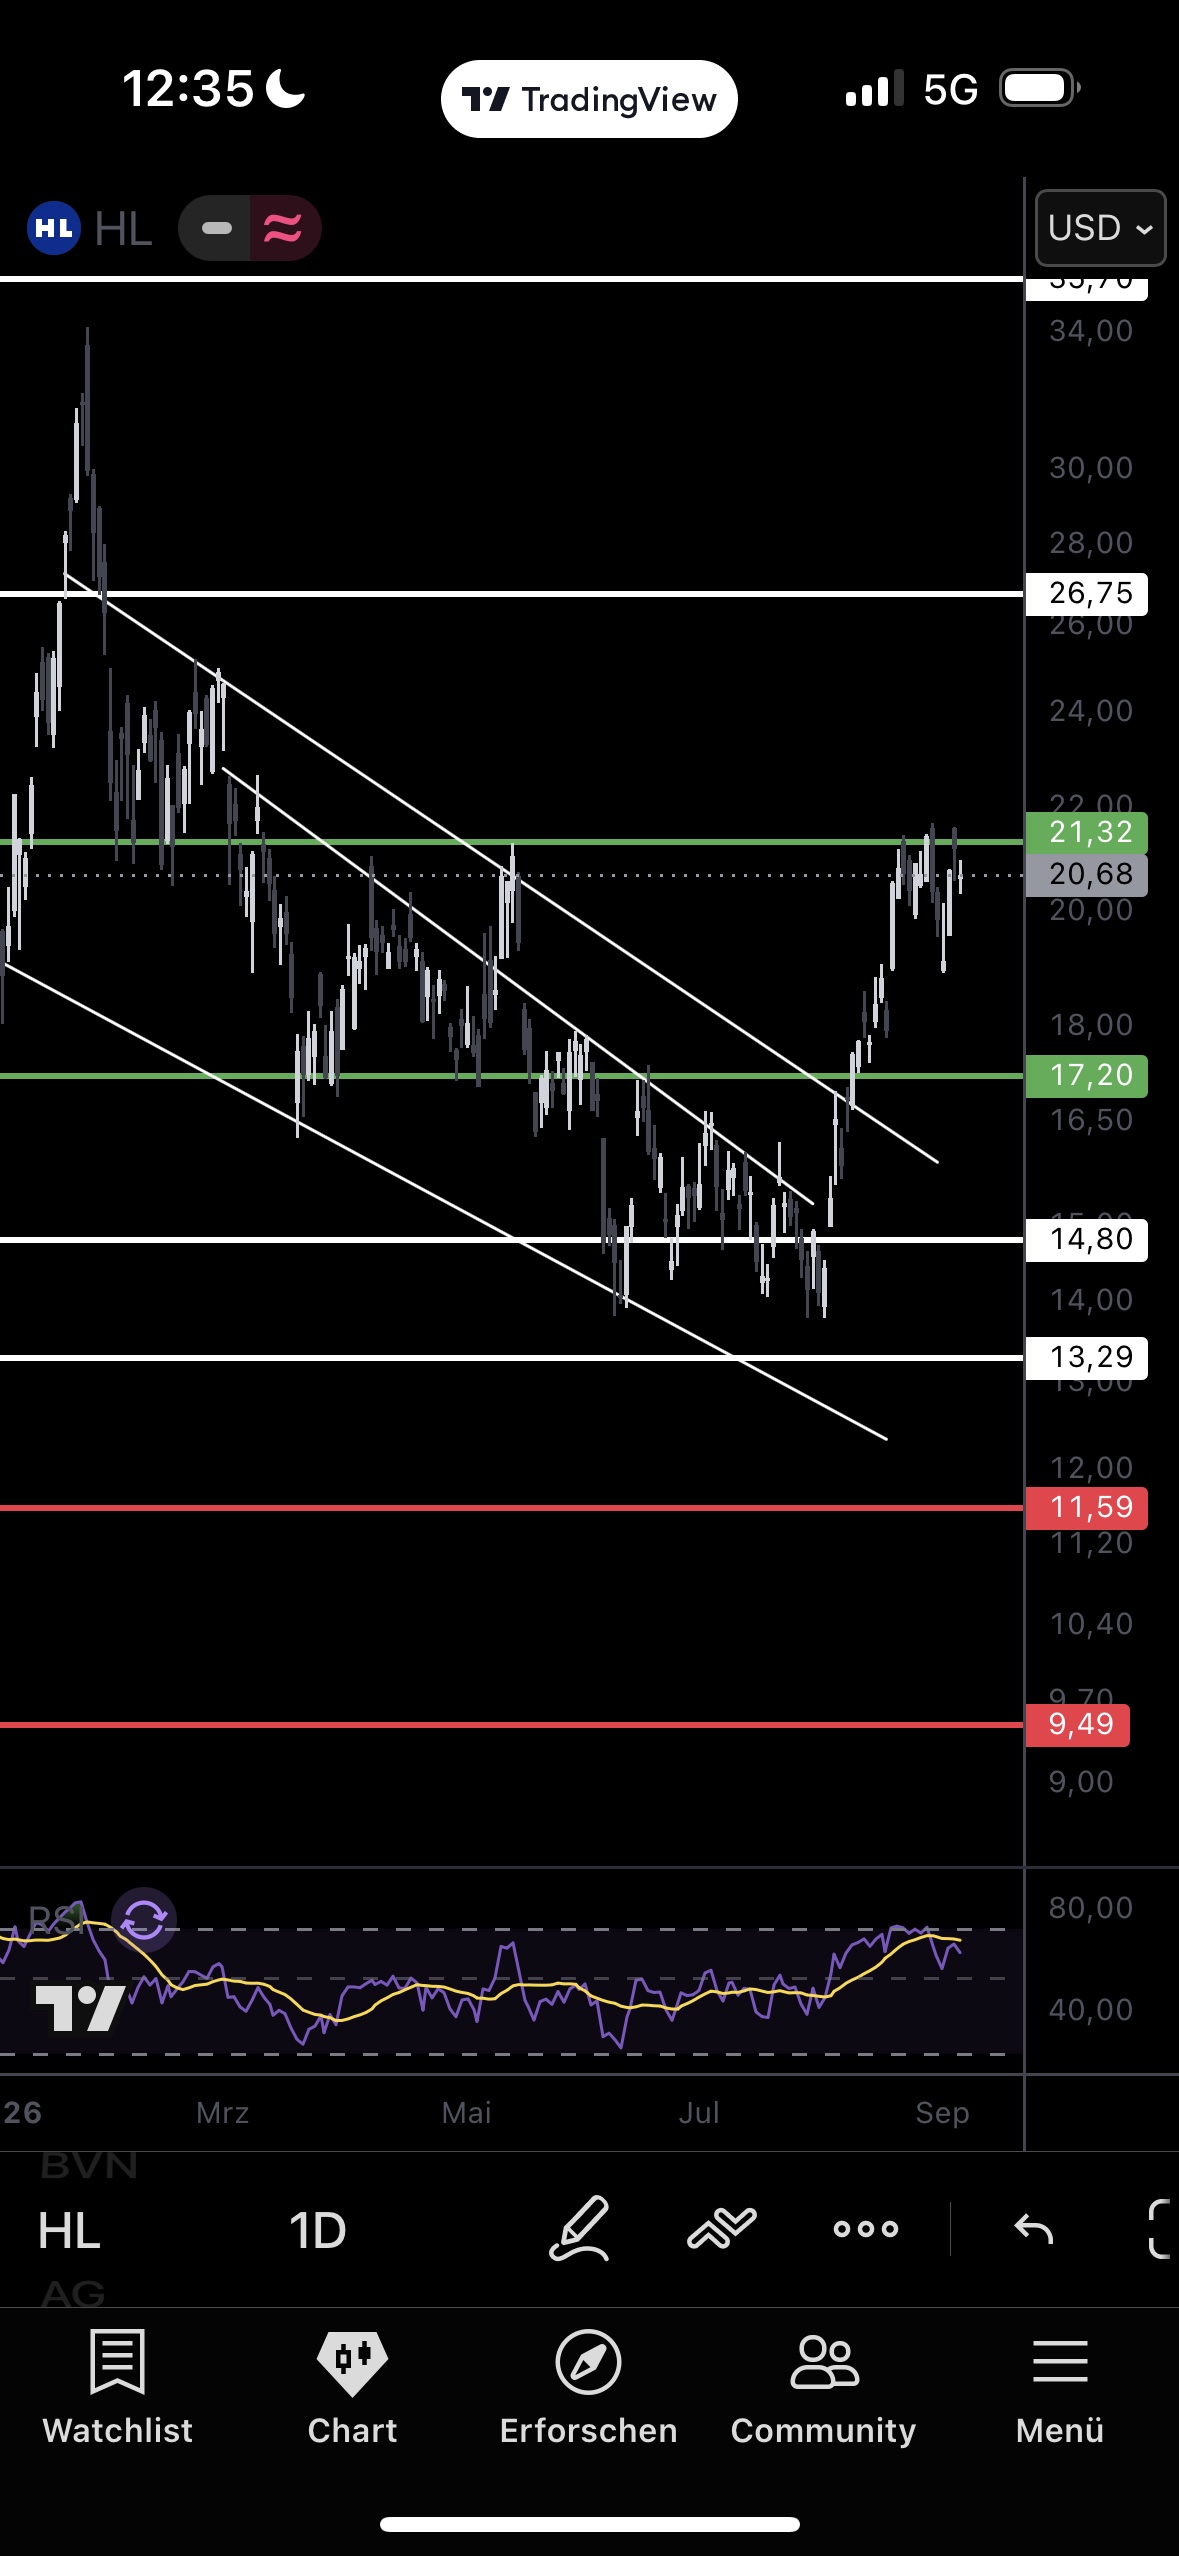
1D
4H
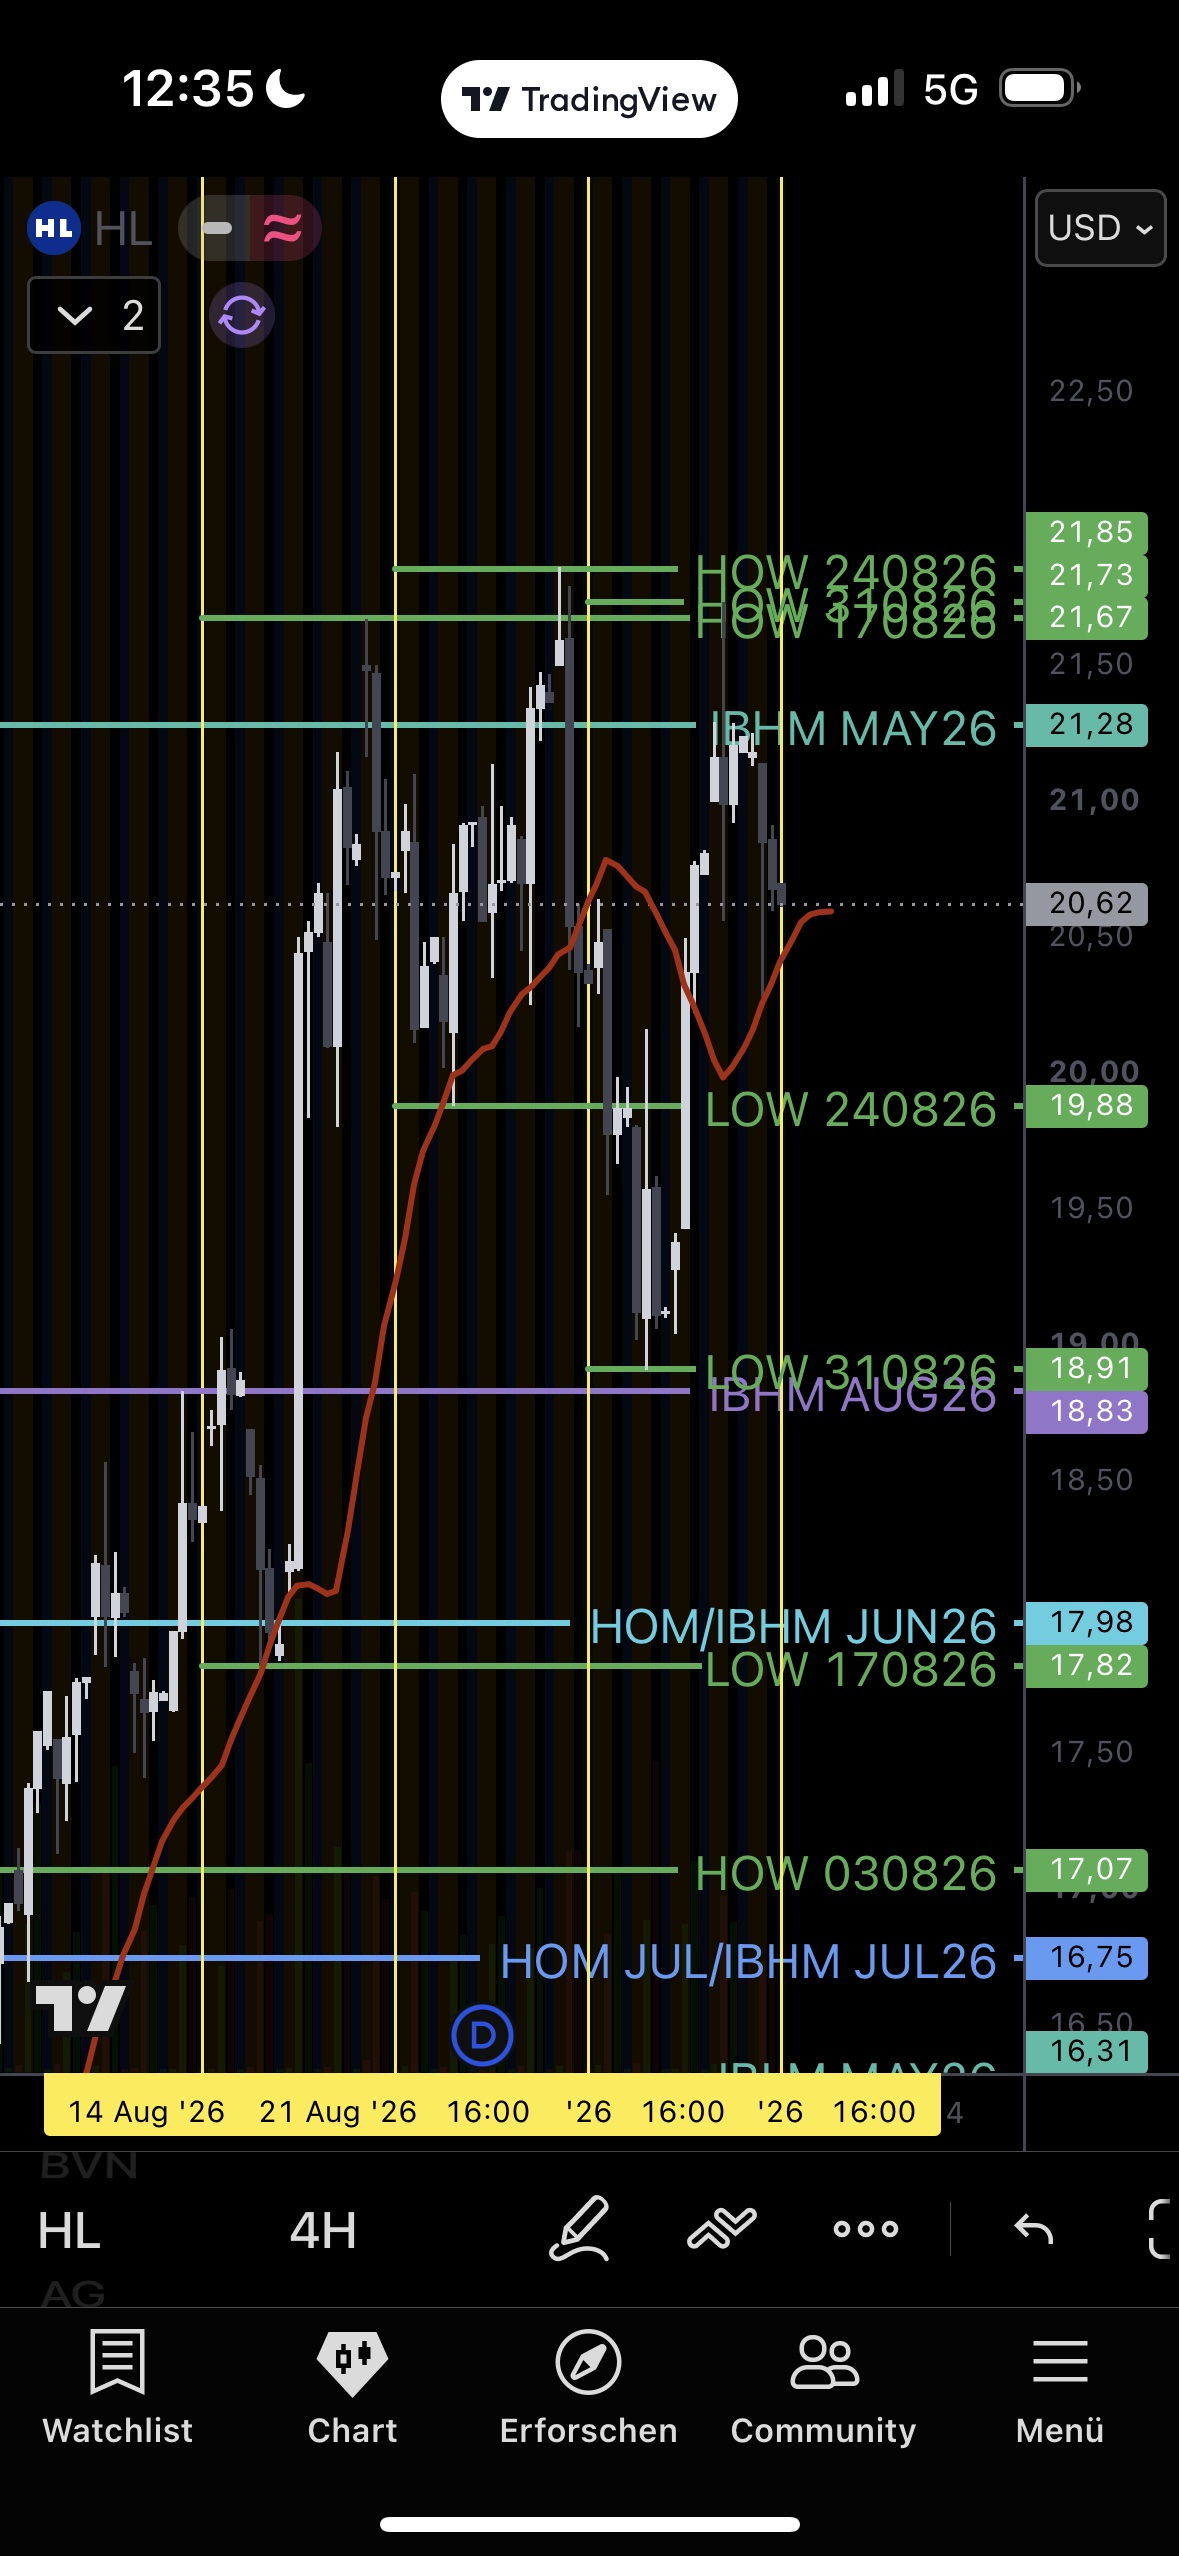
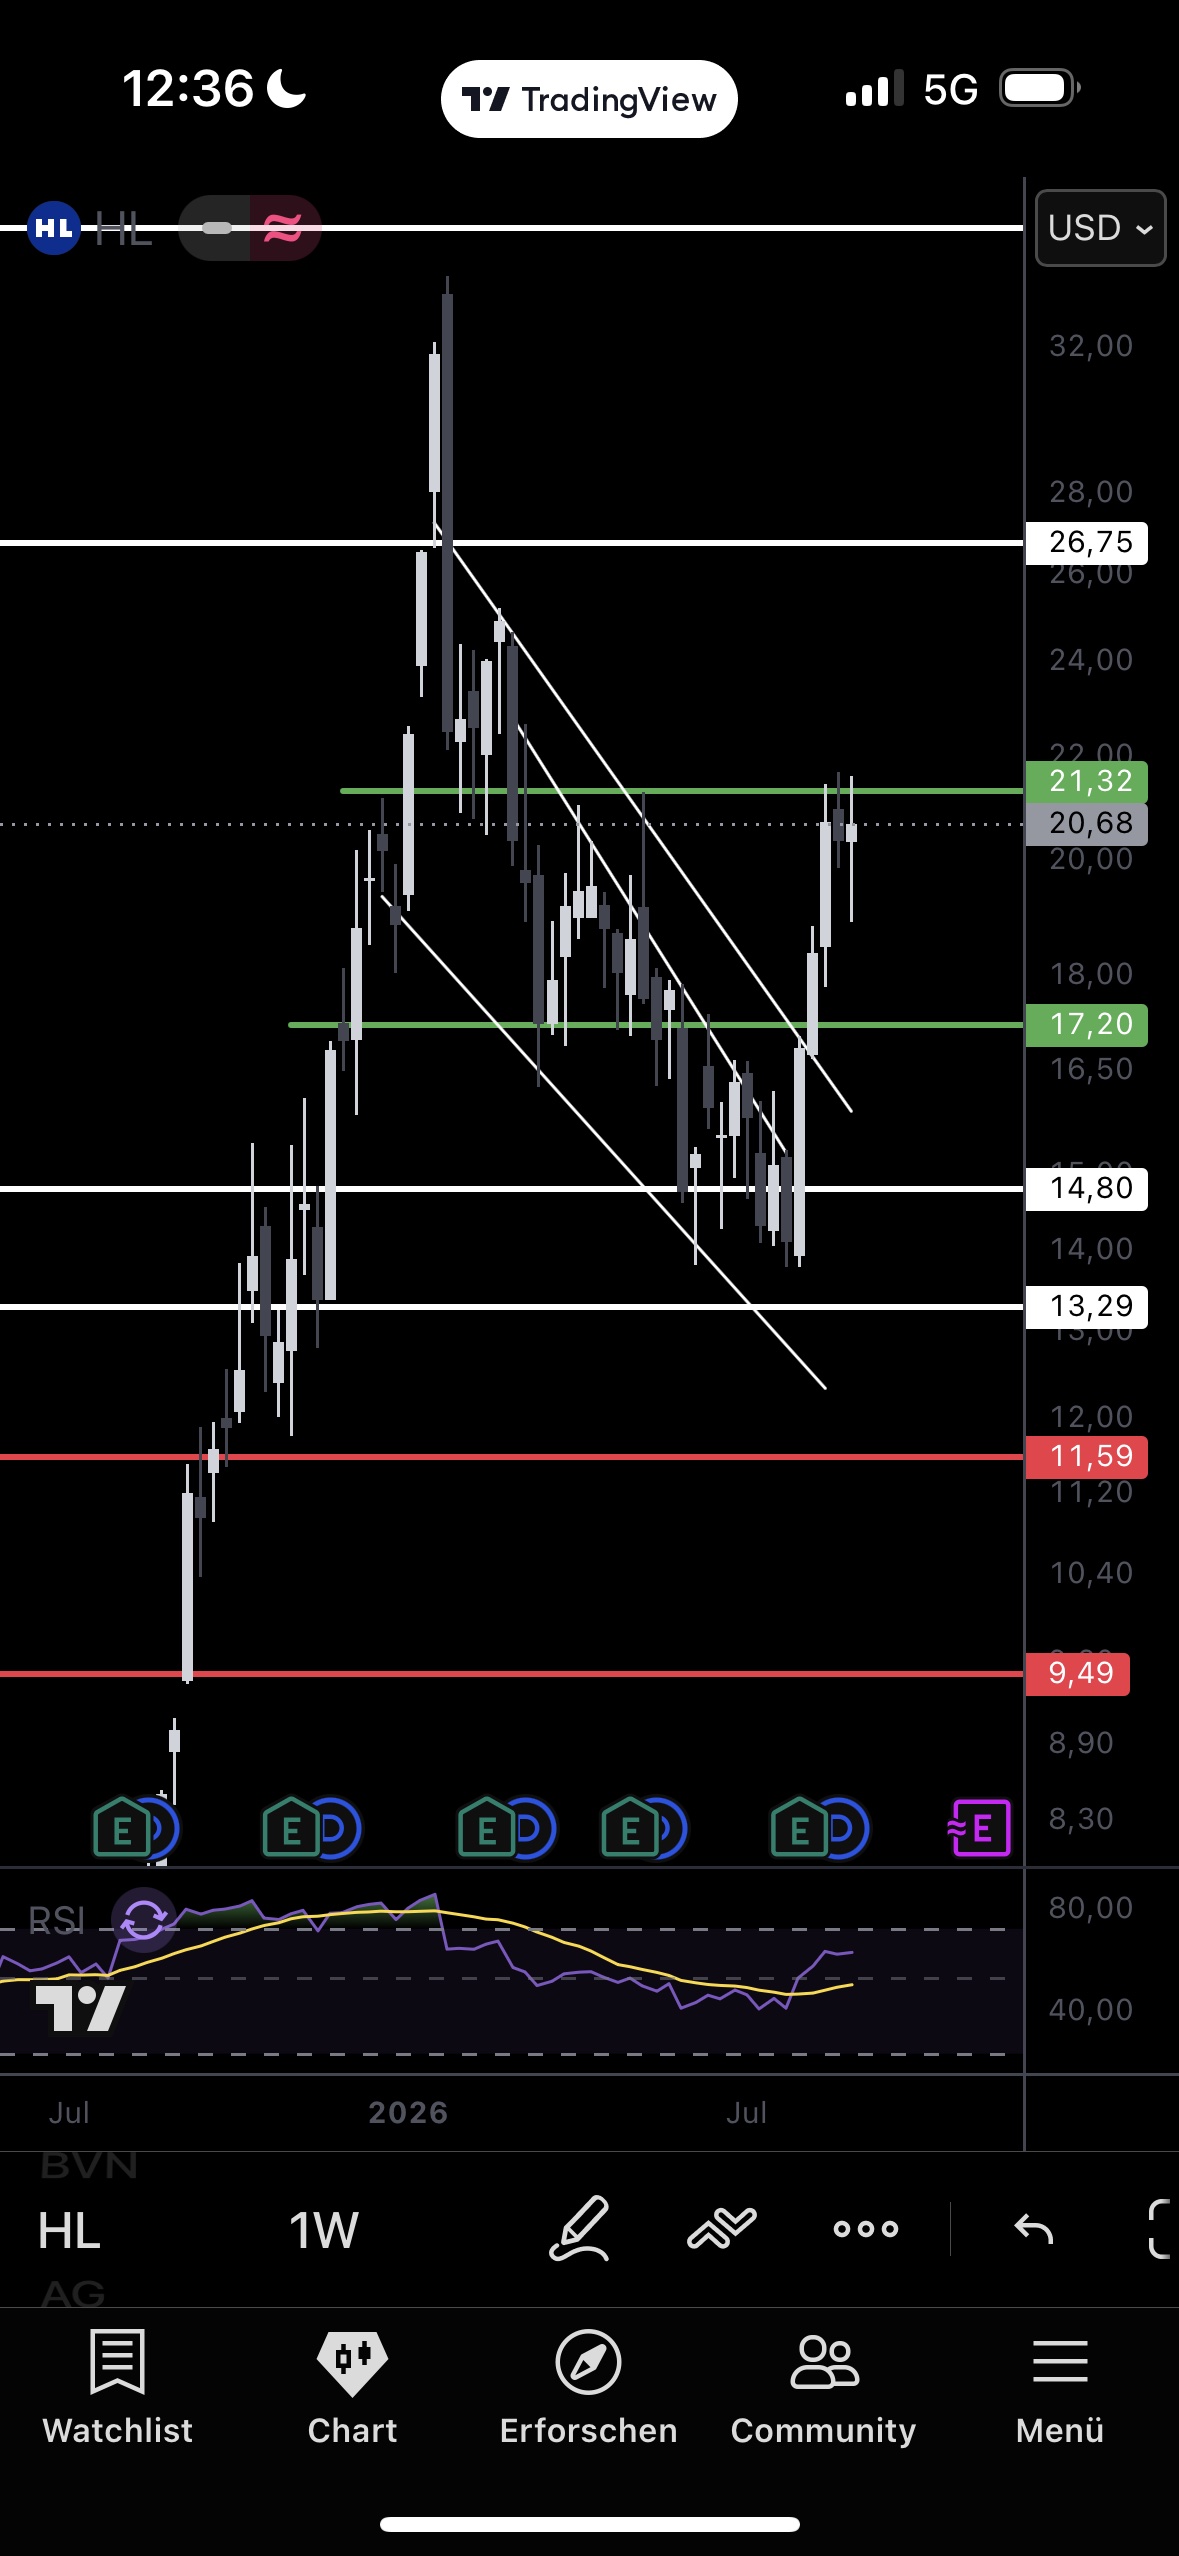
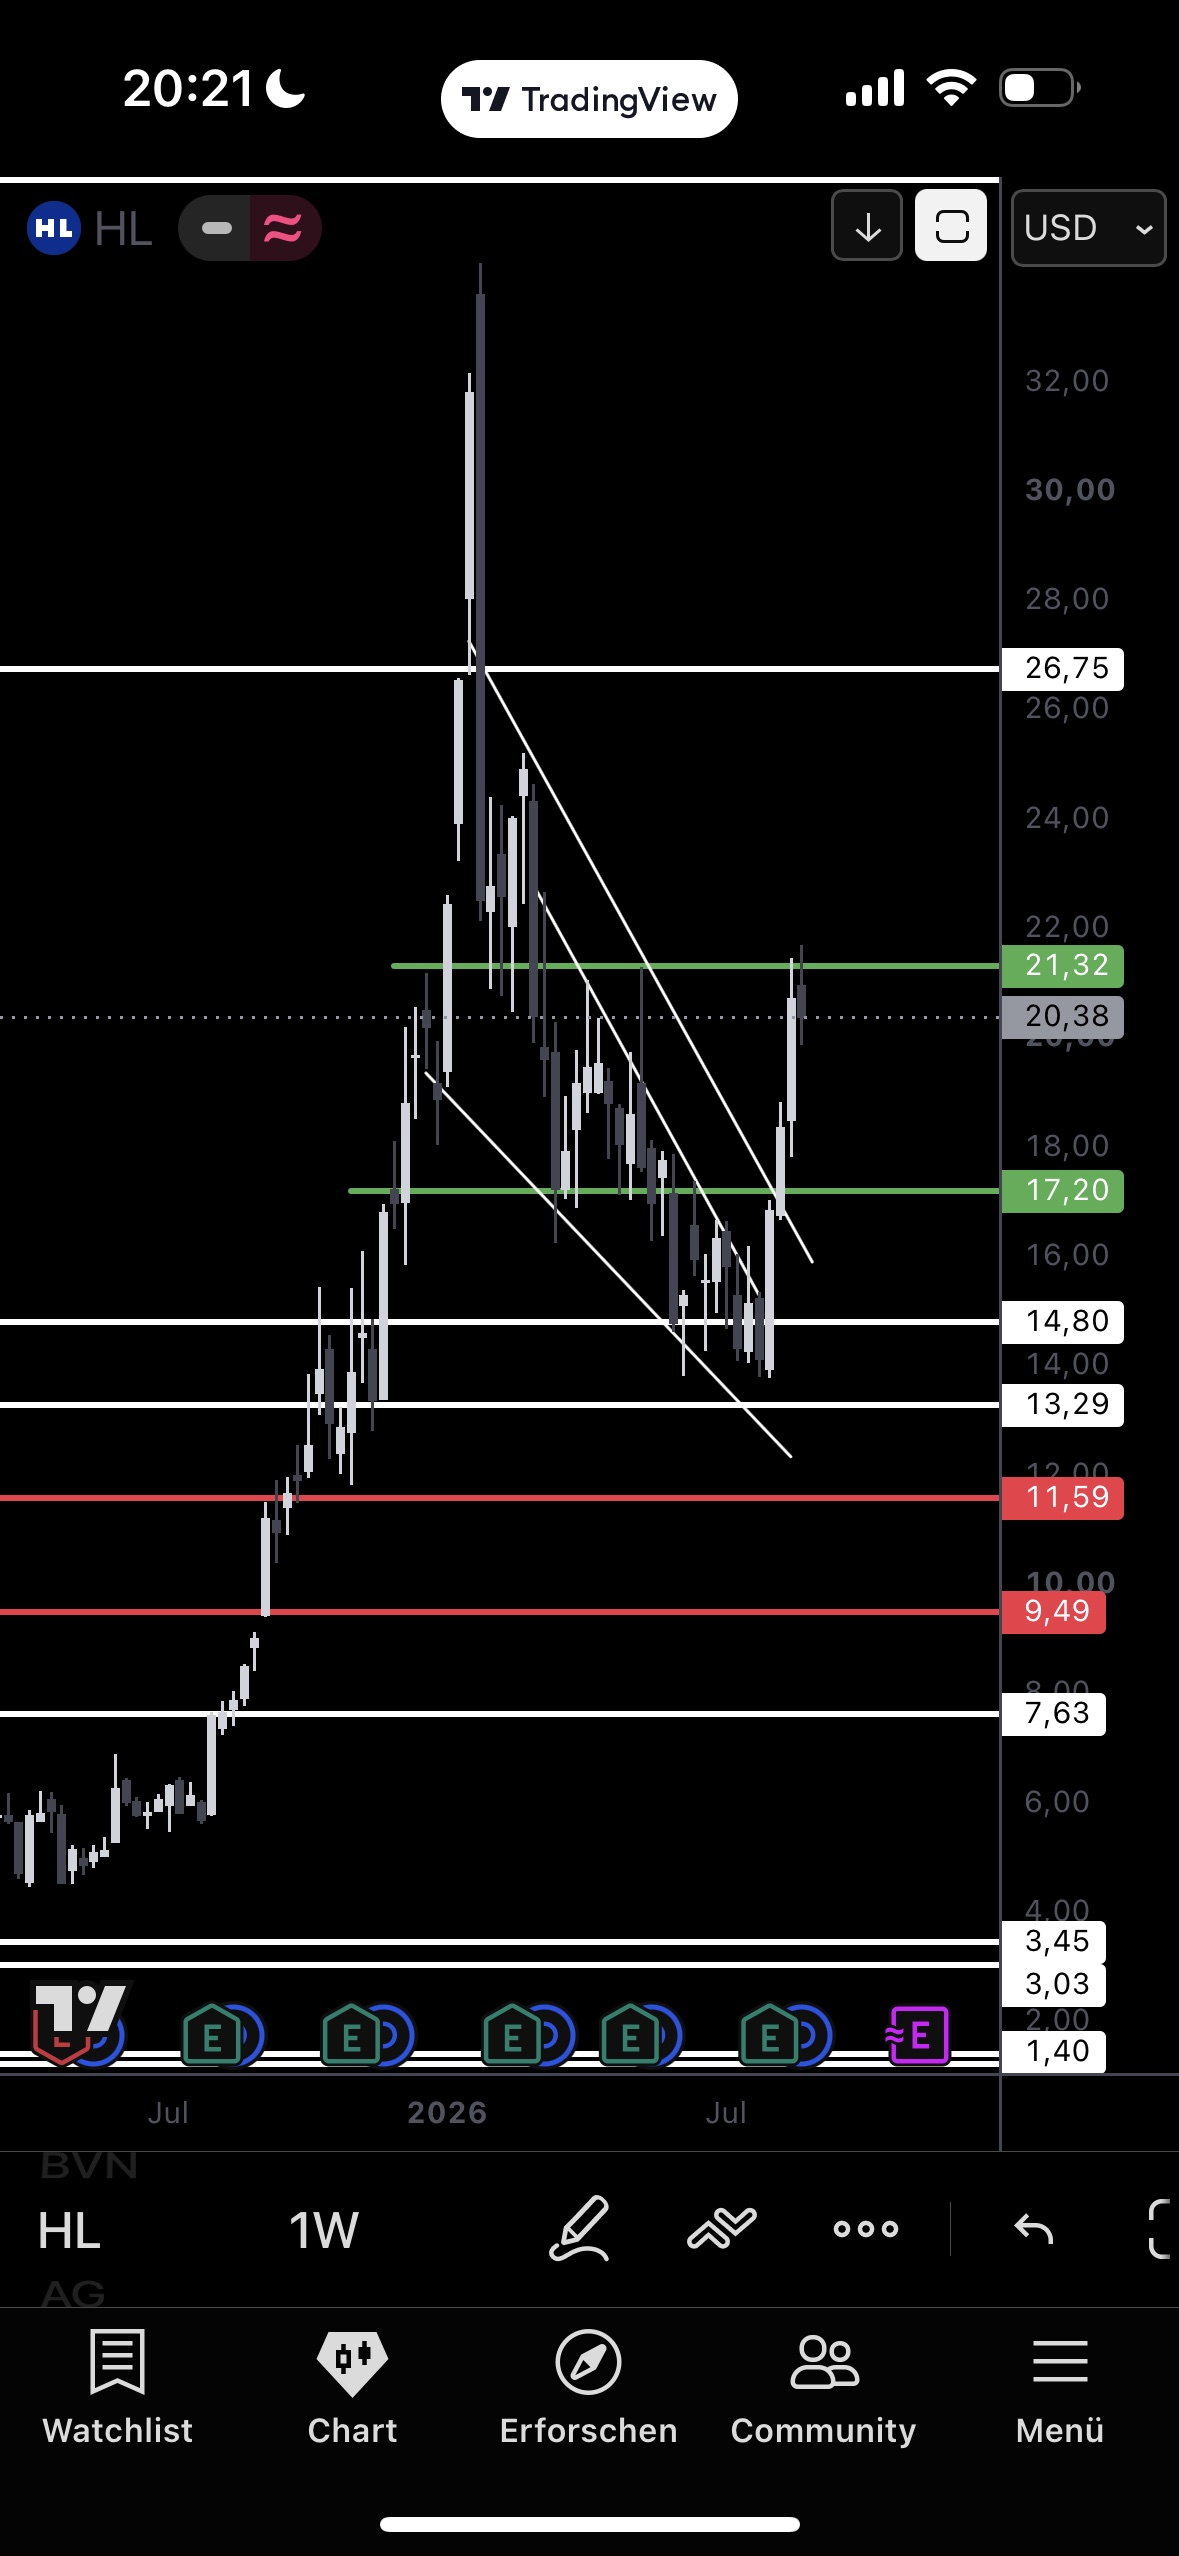
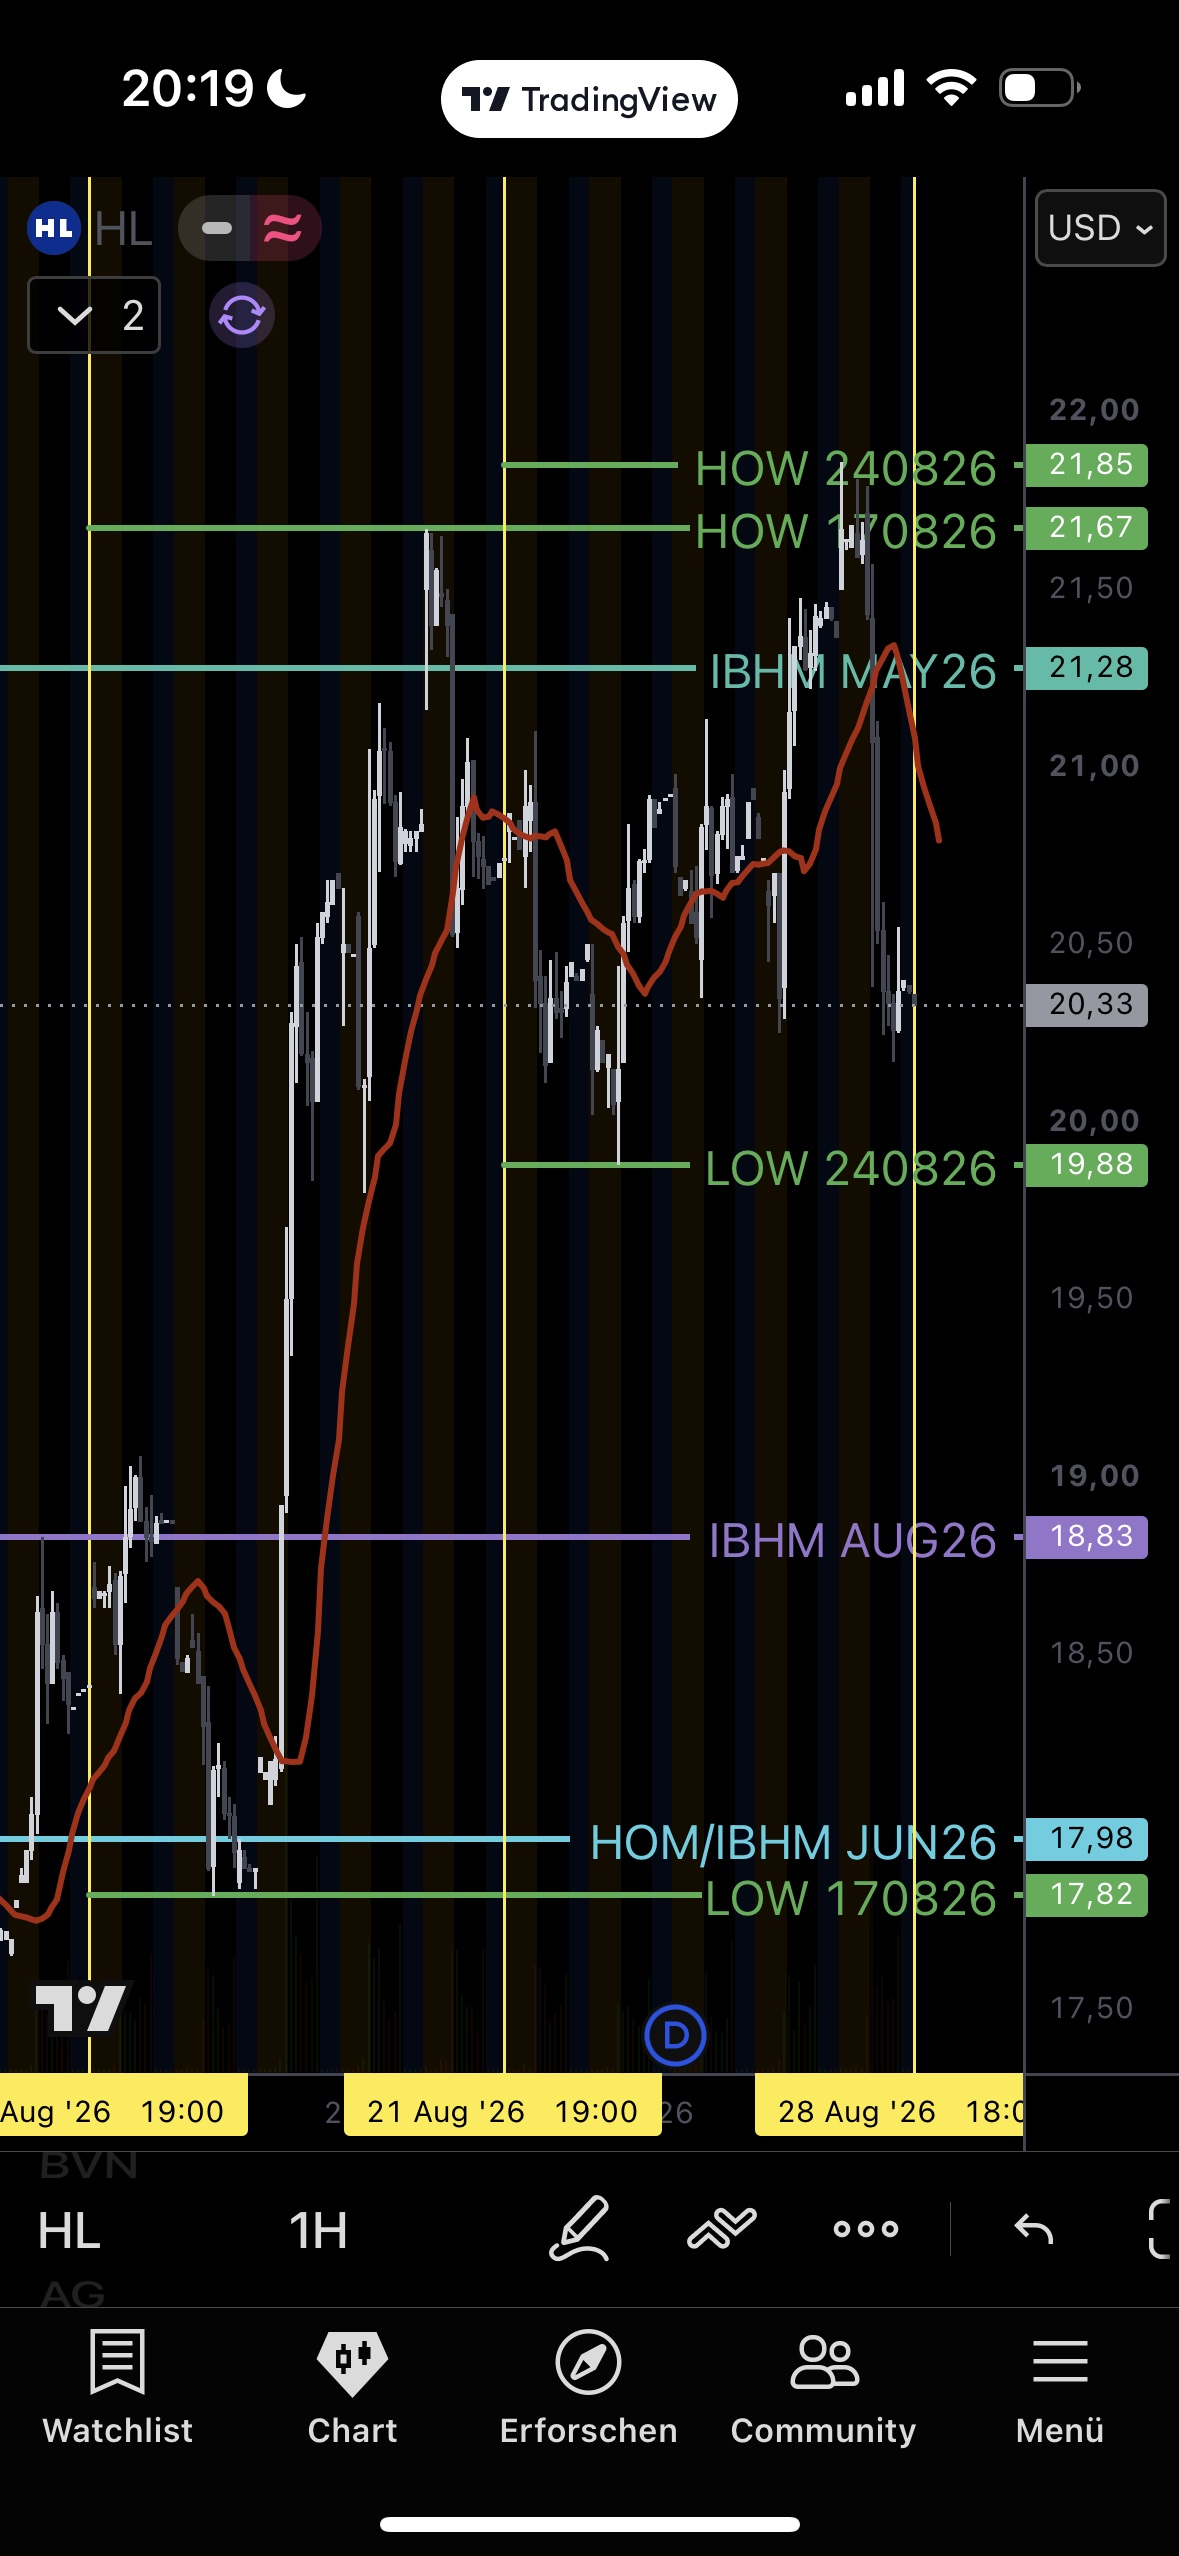
Fourth test of the 21.32 resistance zone in four weeks, no breakout, the rotation is tightening. Correction of last week: the "continuously rising lows" thesis no longer holds — LOW310826 (18.91) sits below LOW240826 (19.88), the 21.73 high slightly below 21.85. No accumulation structure anymore, but a genuine, slightly flattening balance without direction. Last week's bullish lean is not overweighted. Triggers: weekly close > 21.32 bullish, < 17.98 erosion of the lower edge; invalidation 16.75 far away. JAN27 15C/16C are held in full until the October trigger, then reduced to 1 contract — a deliberate rule change from full runner.
Fresnillo: rejected twice.
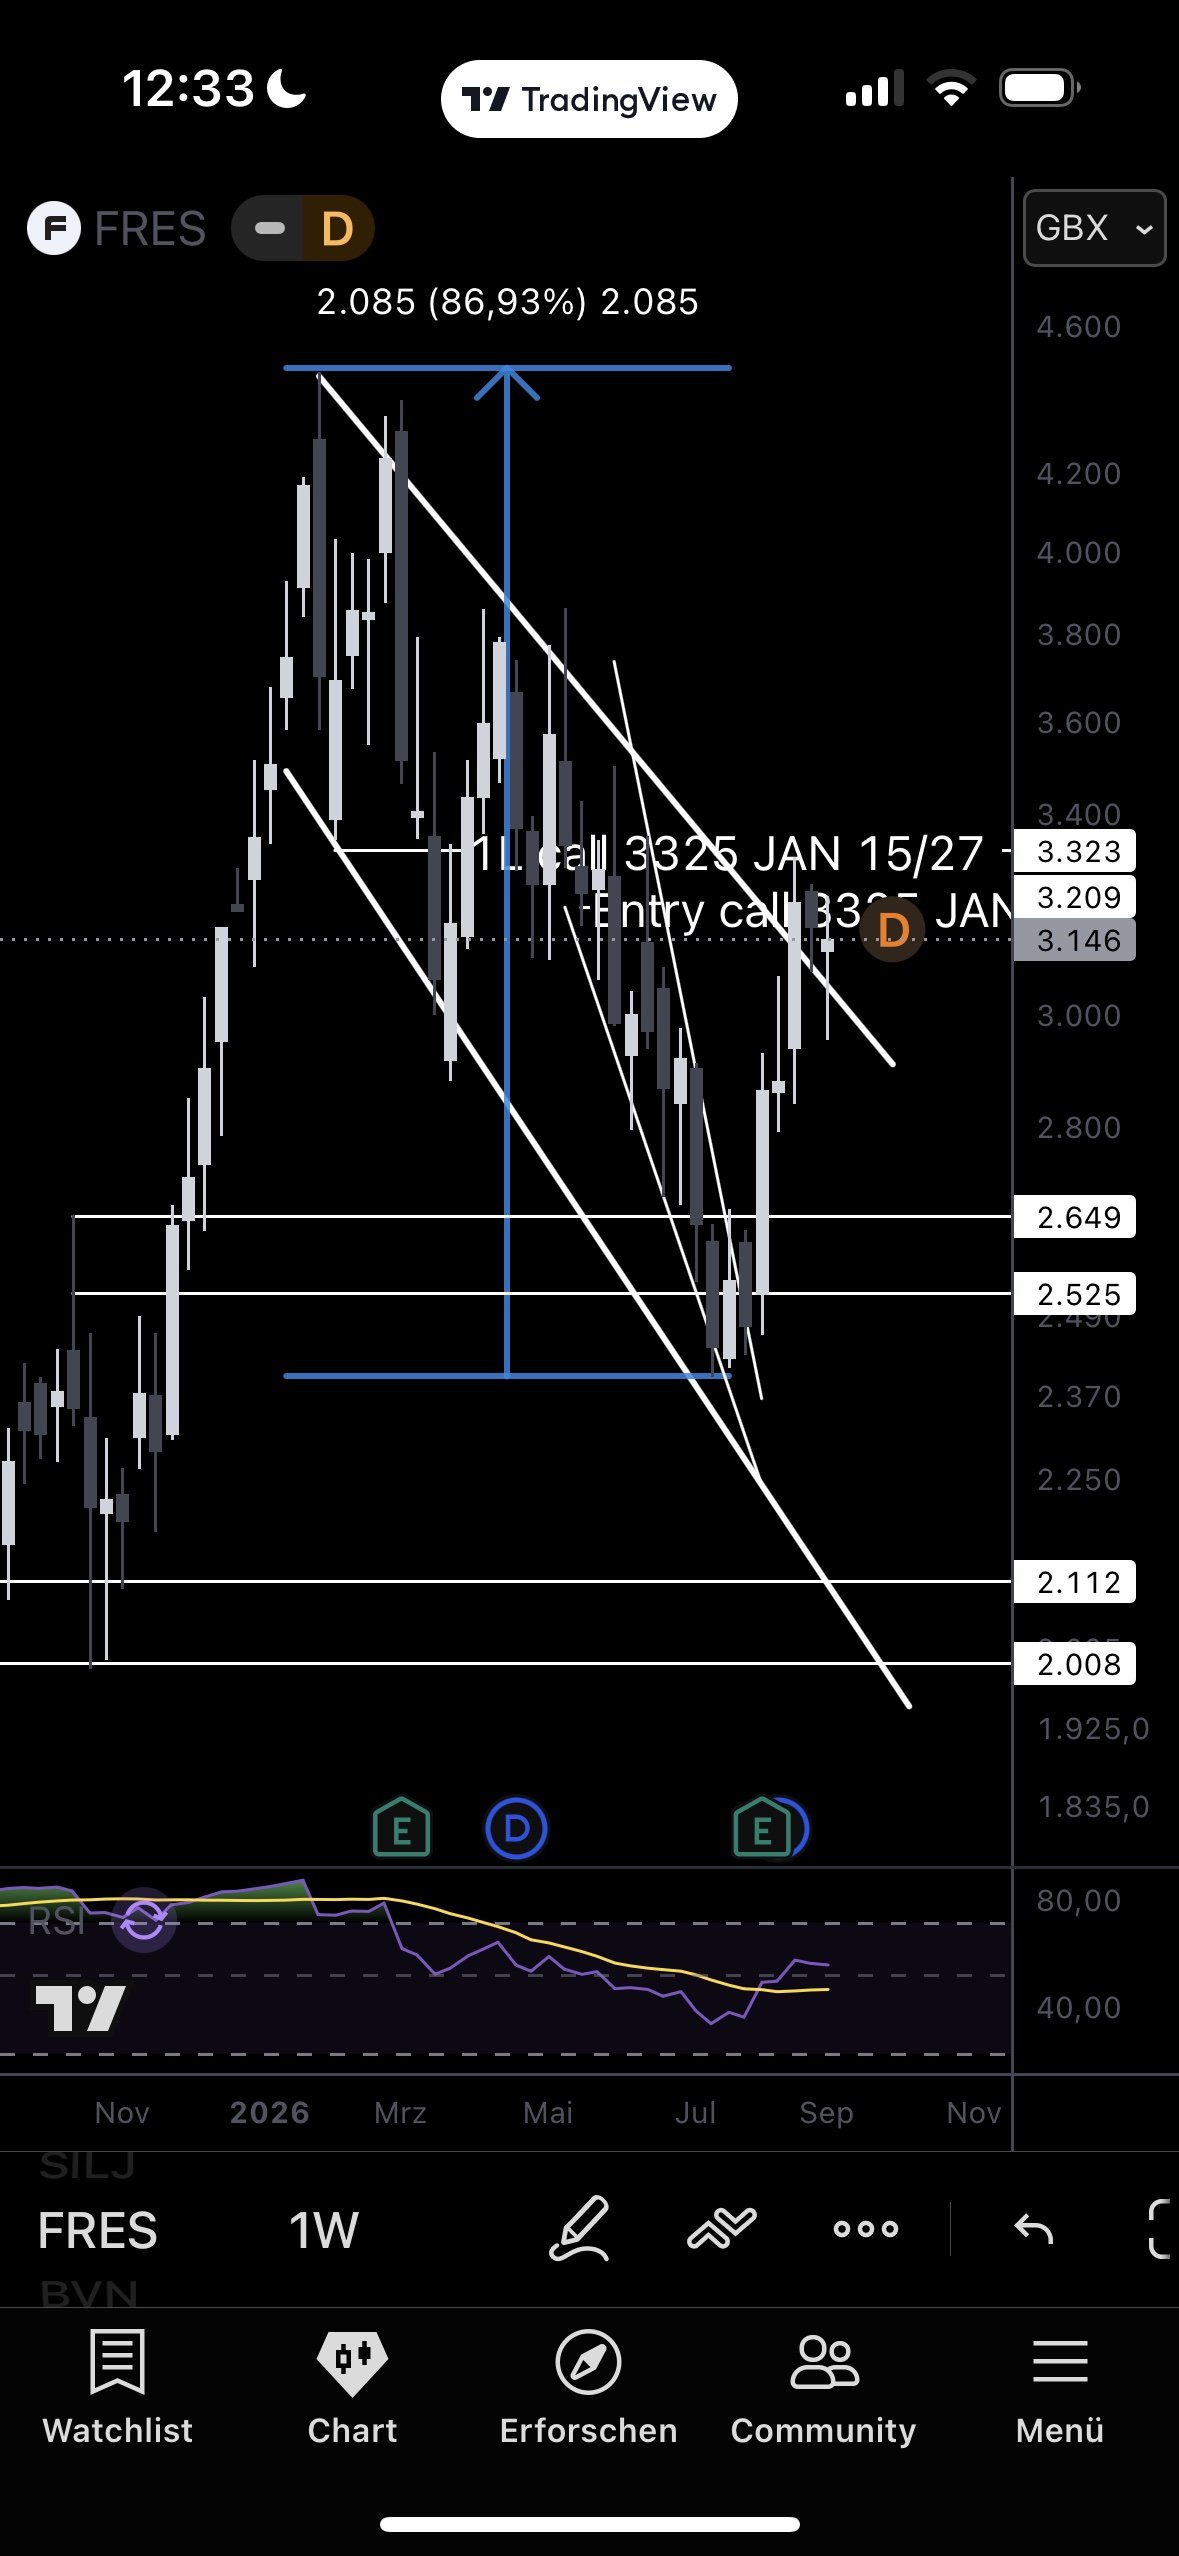
1D
4H
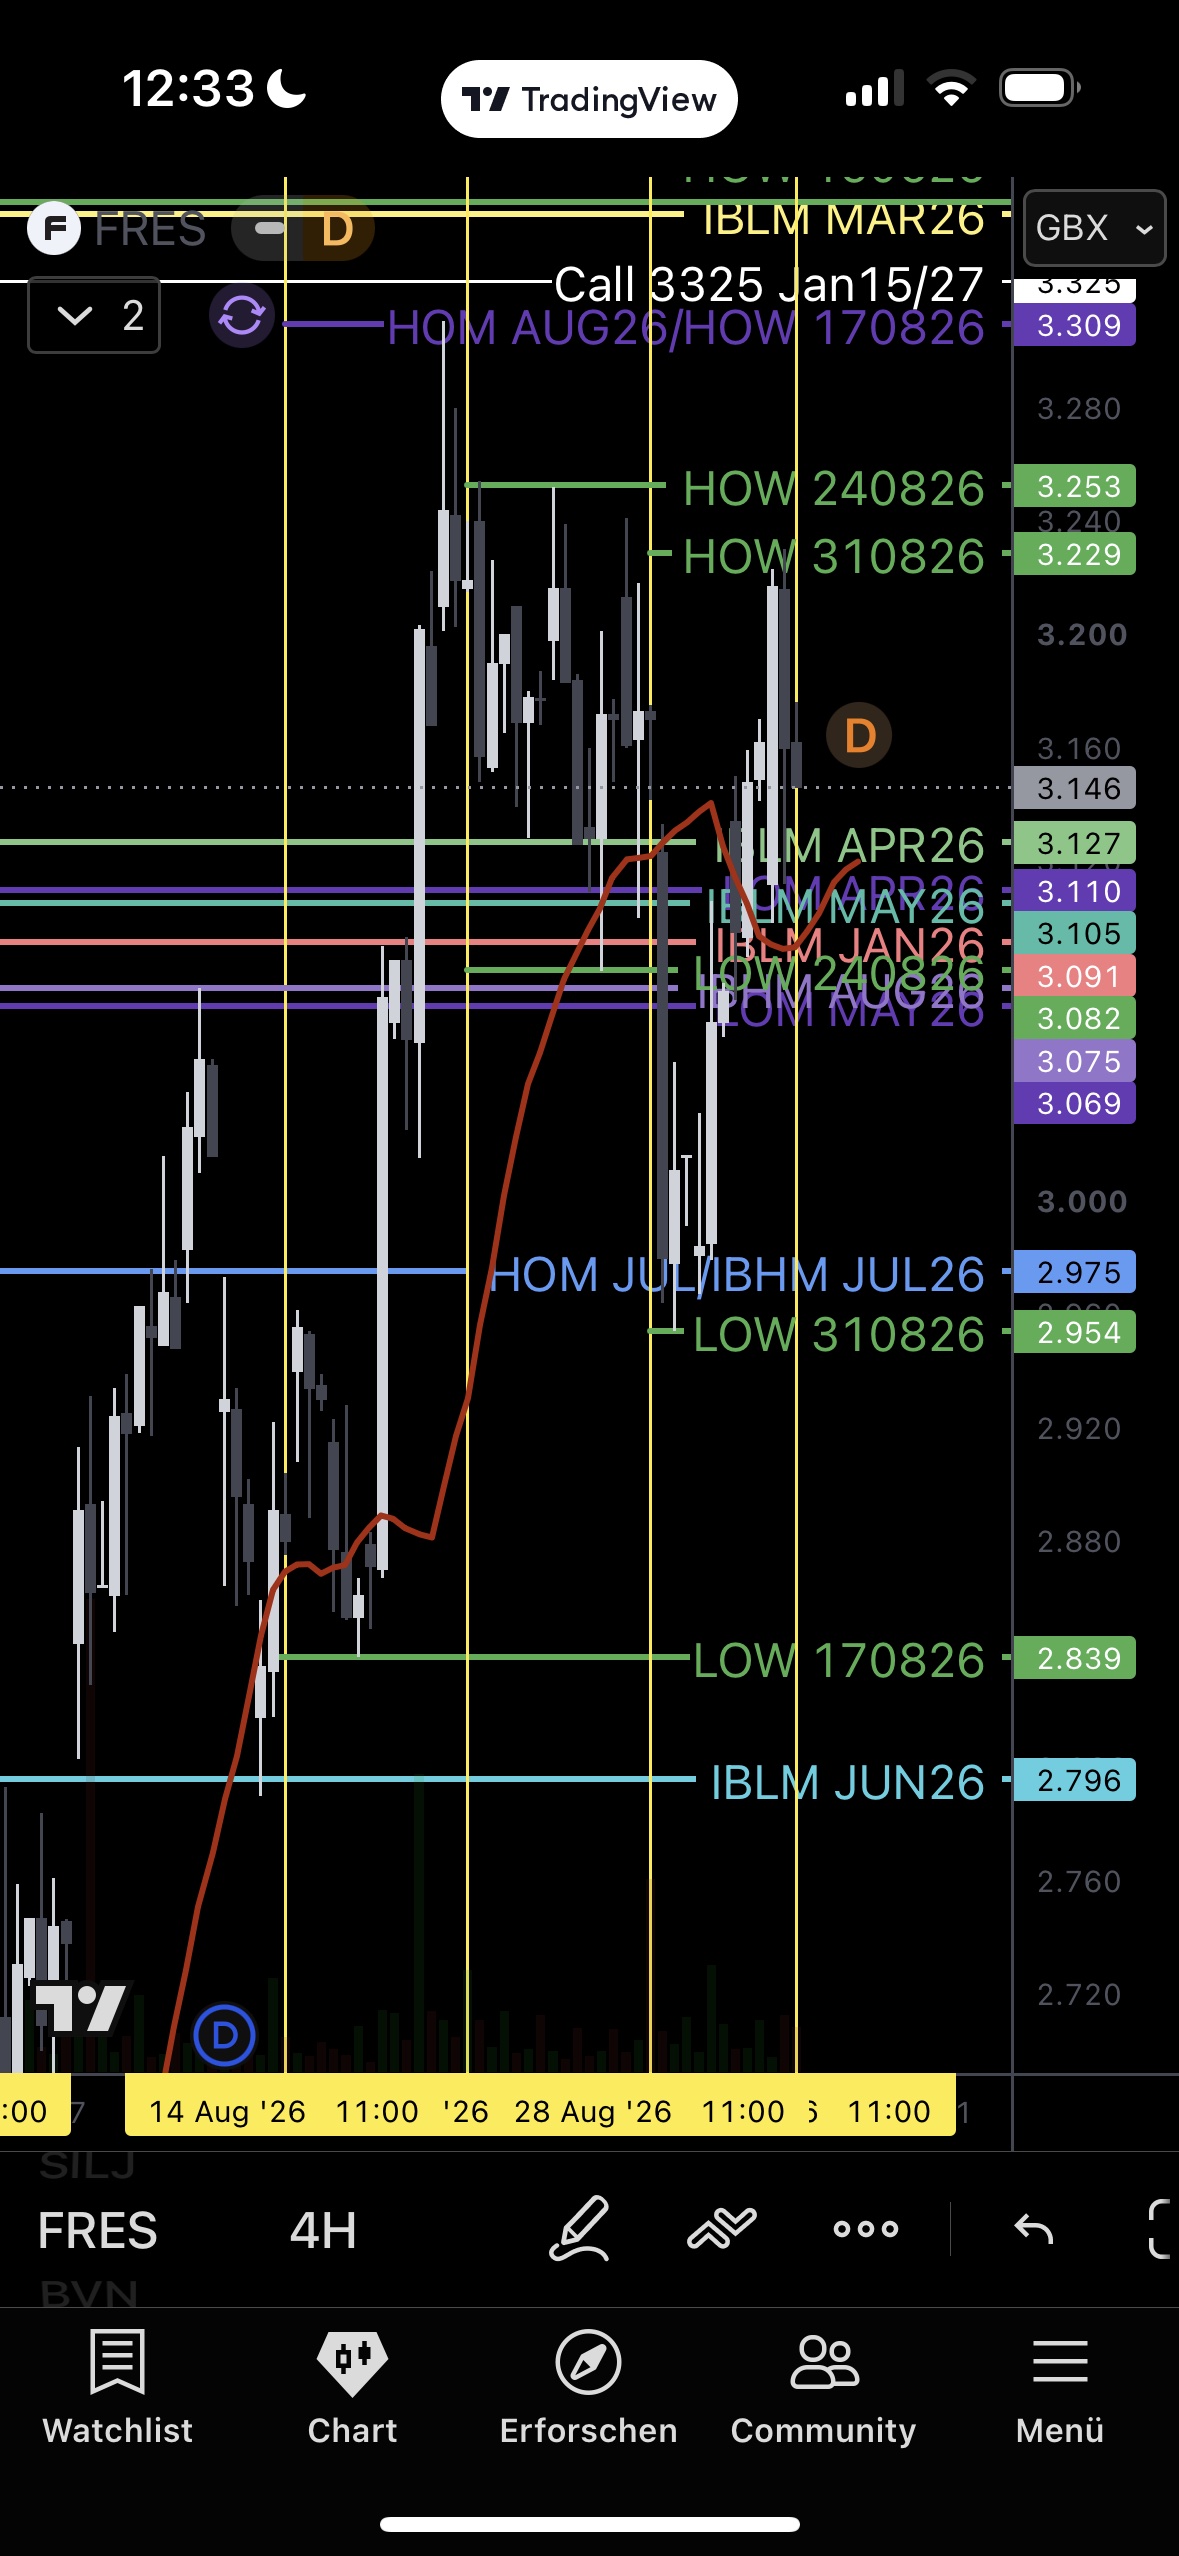
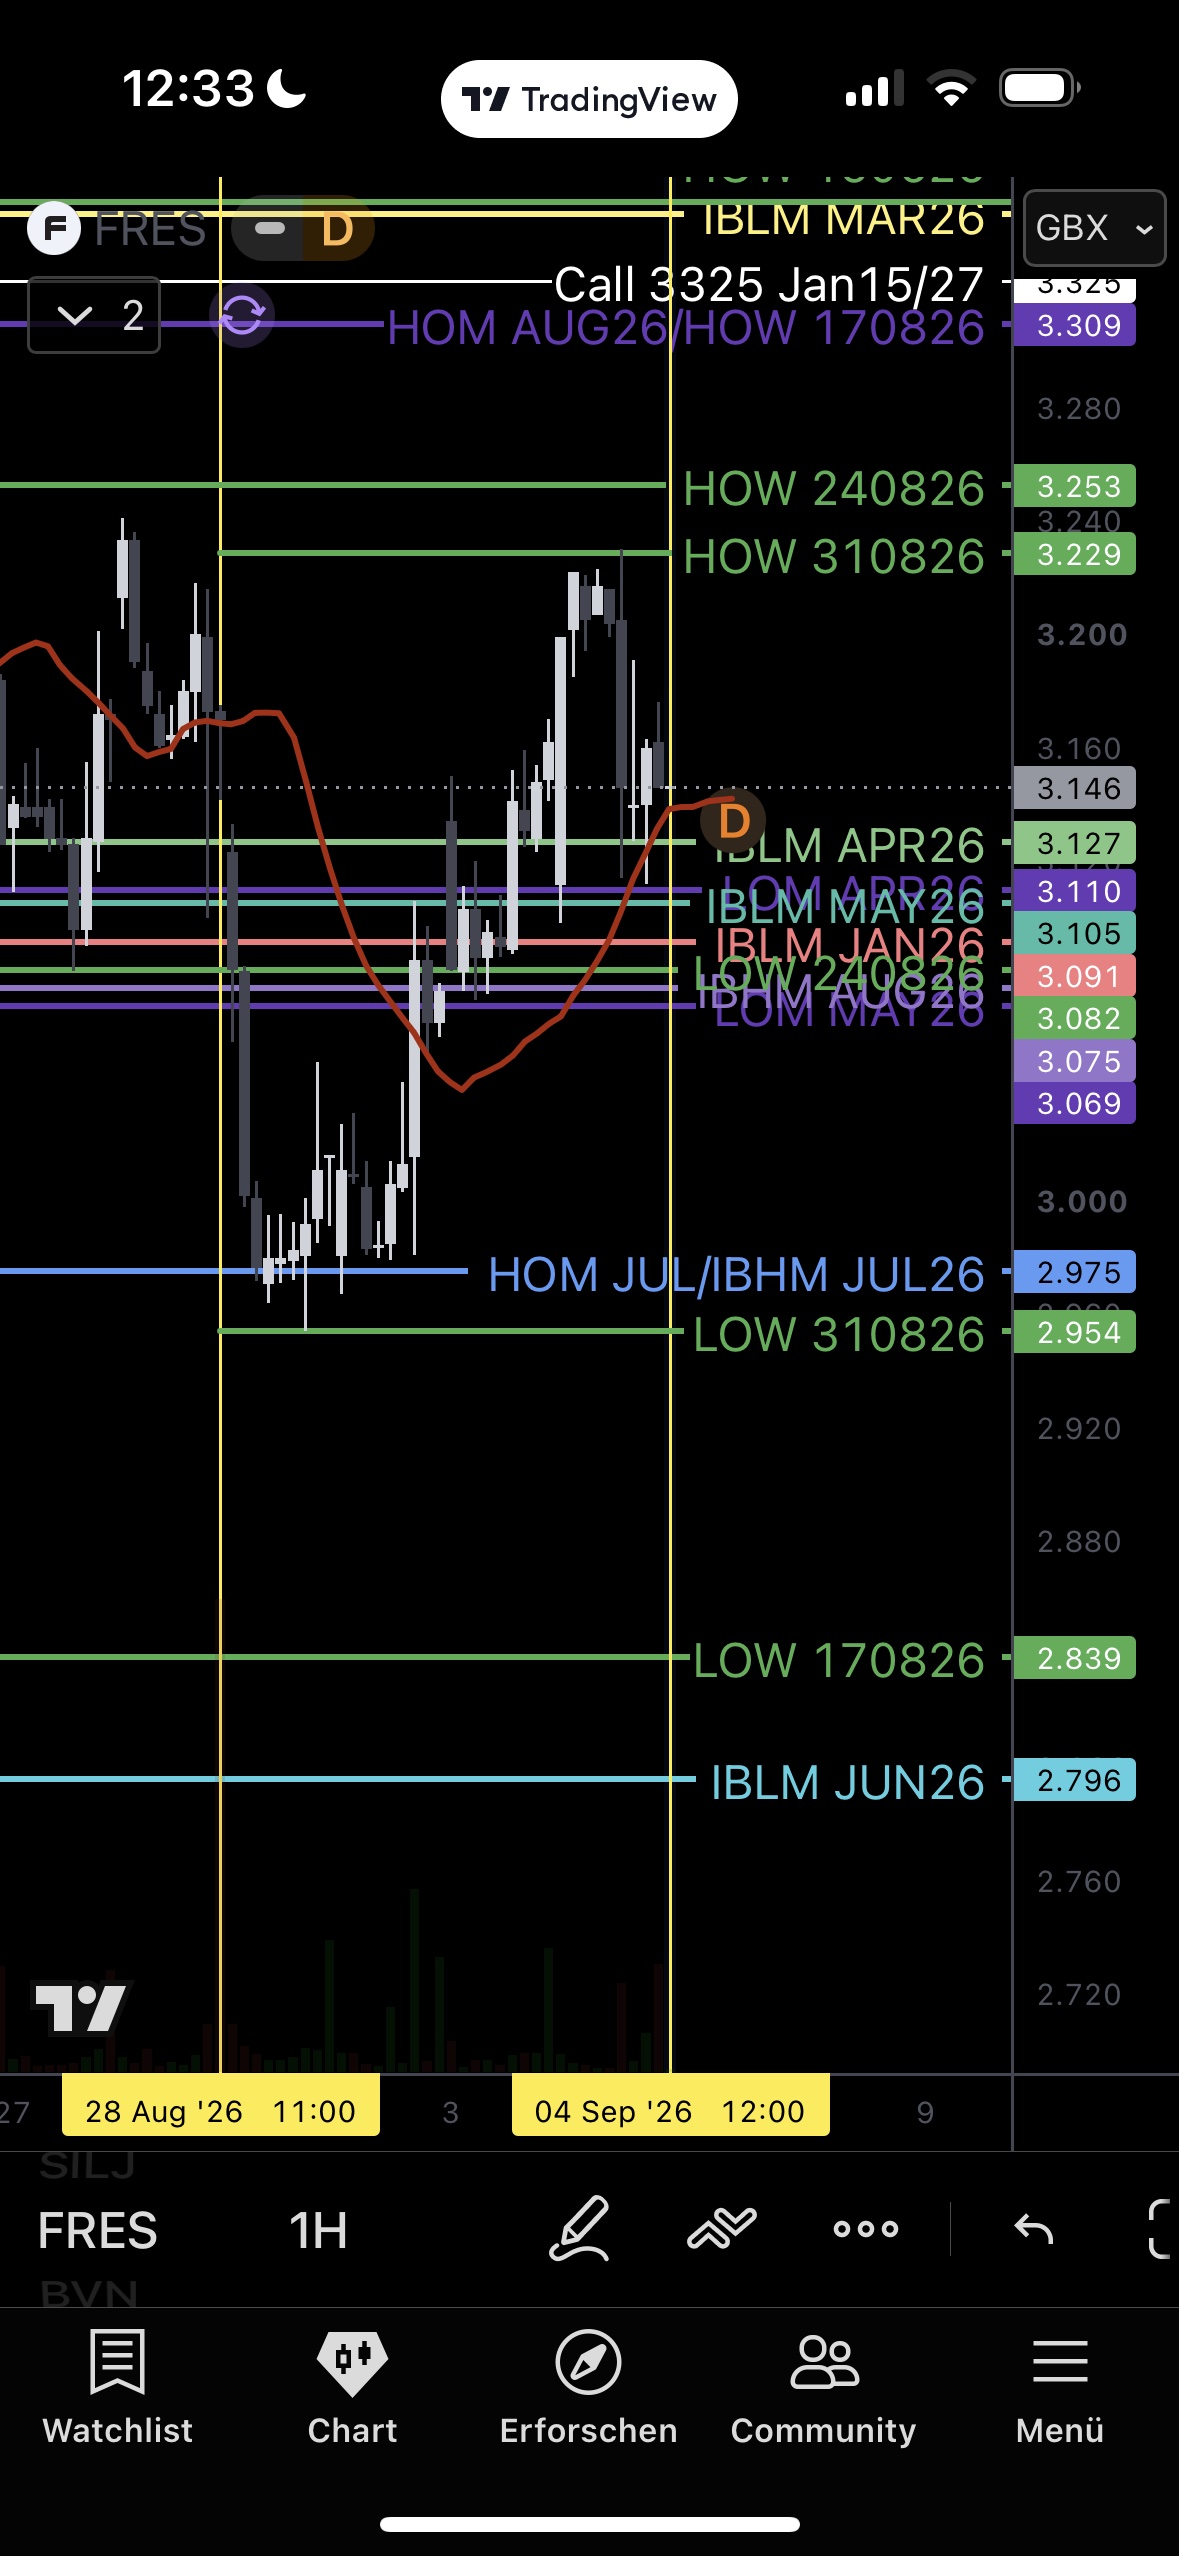
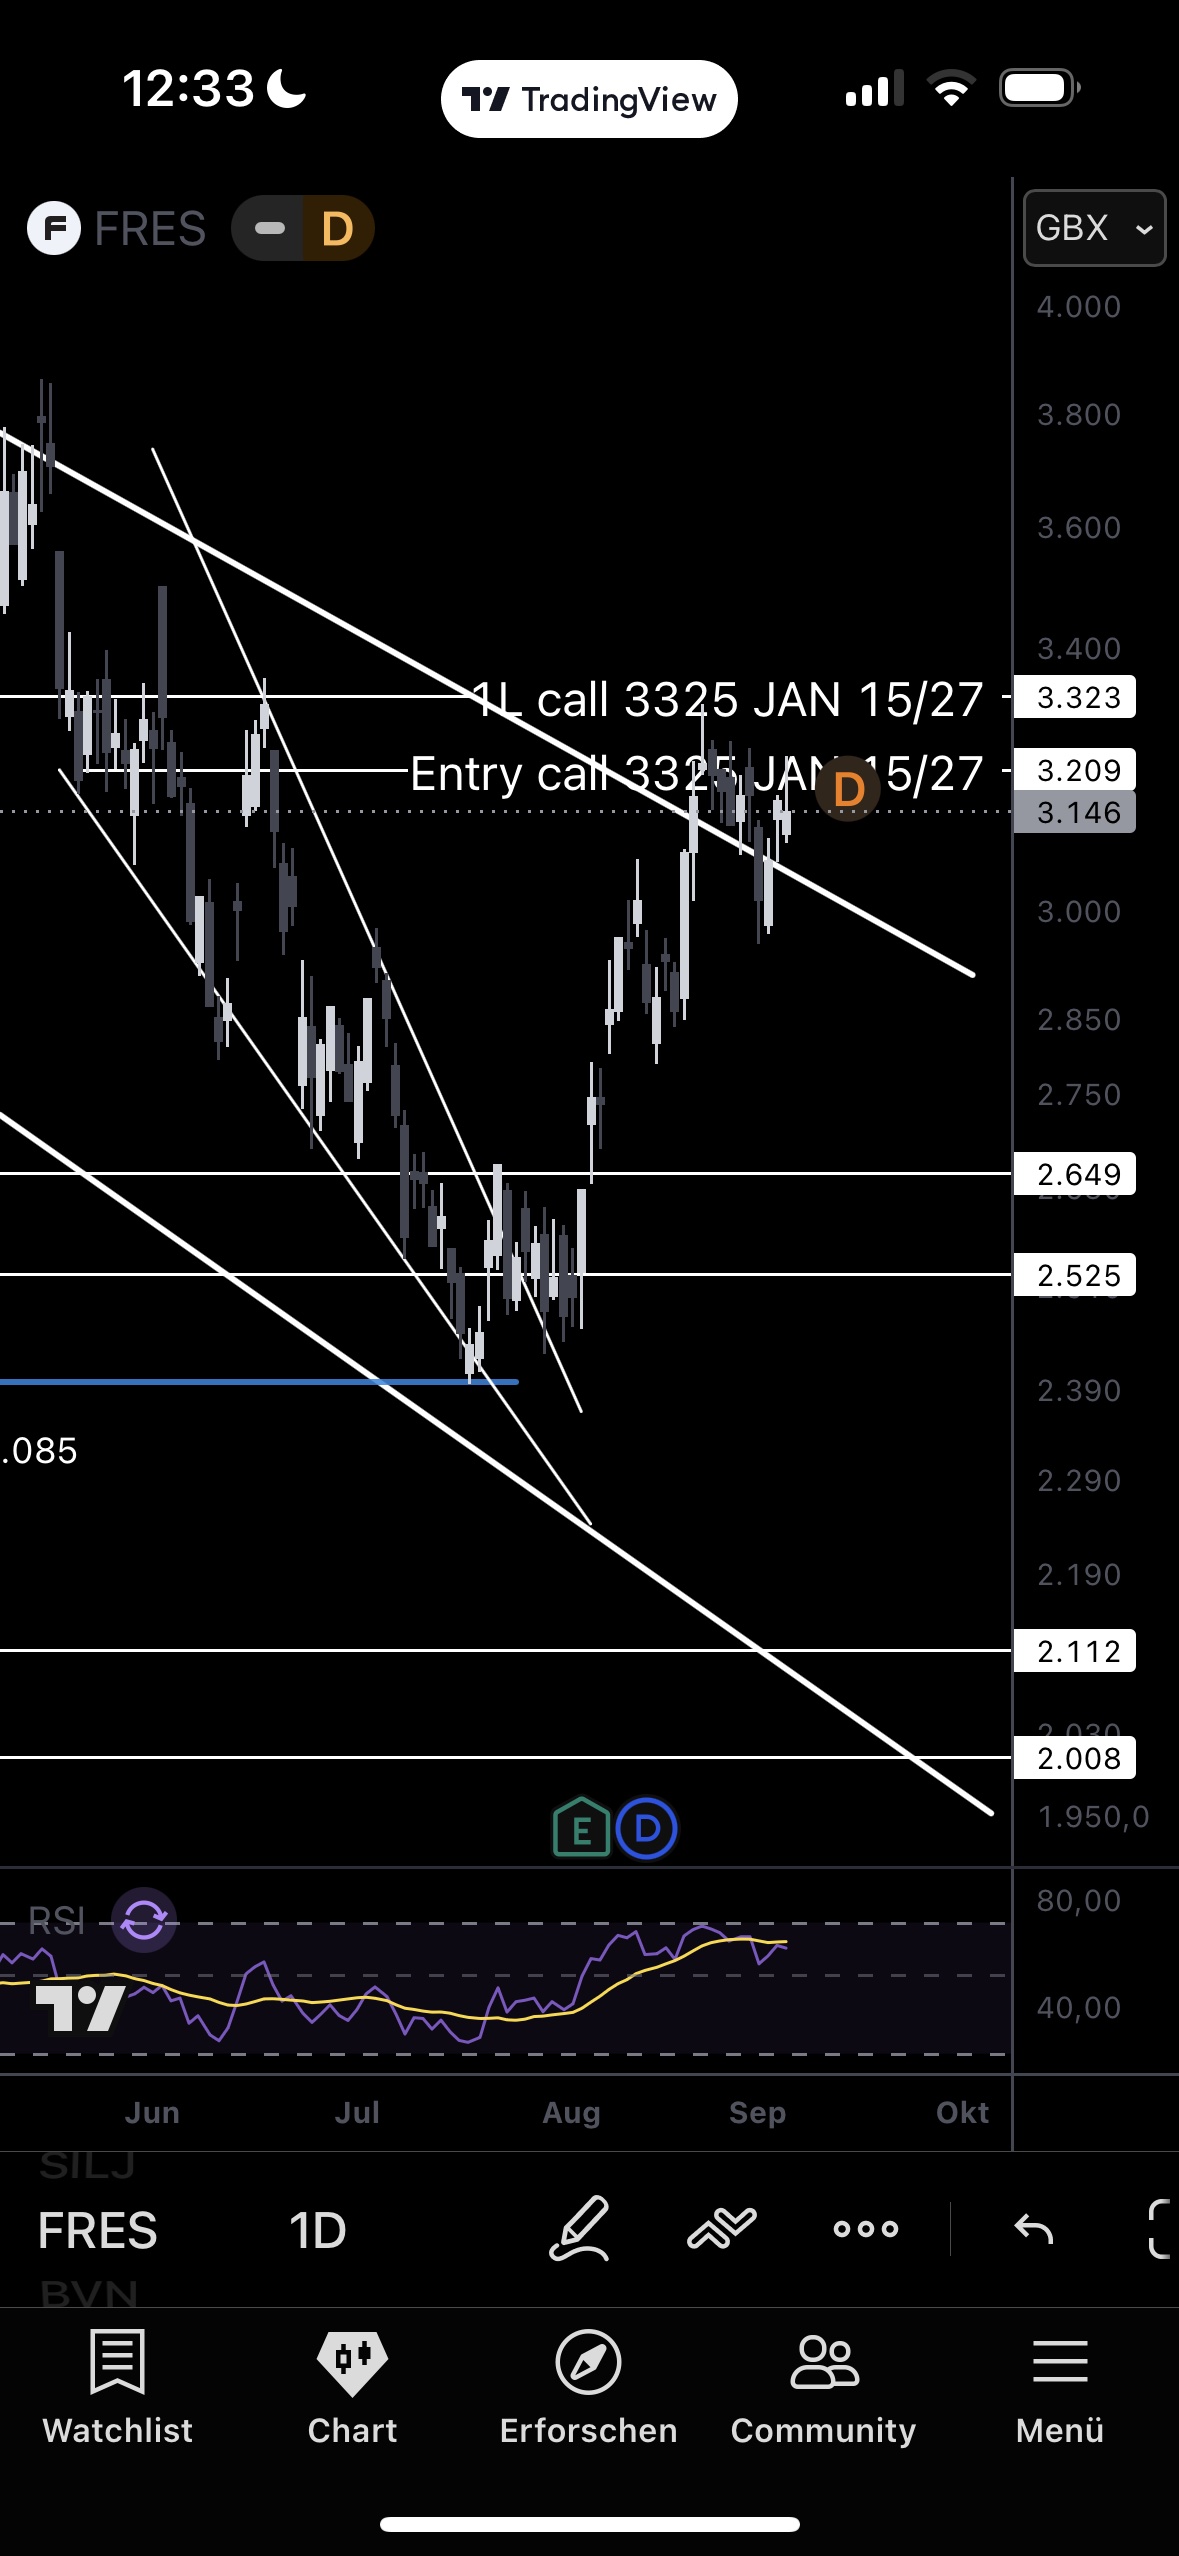
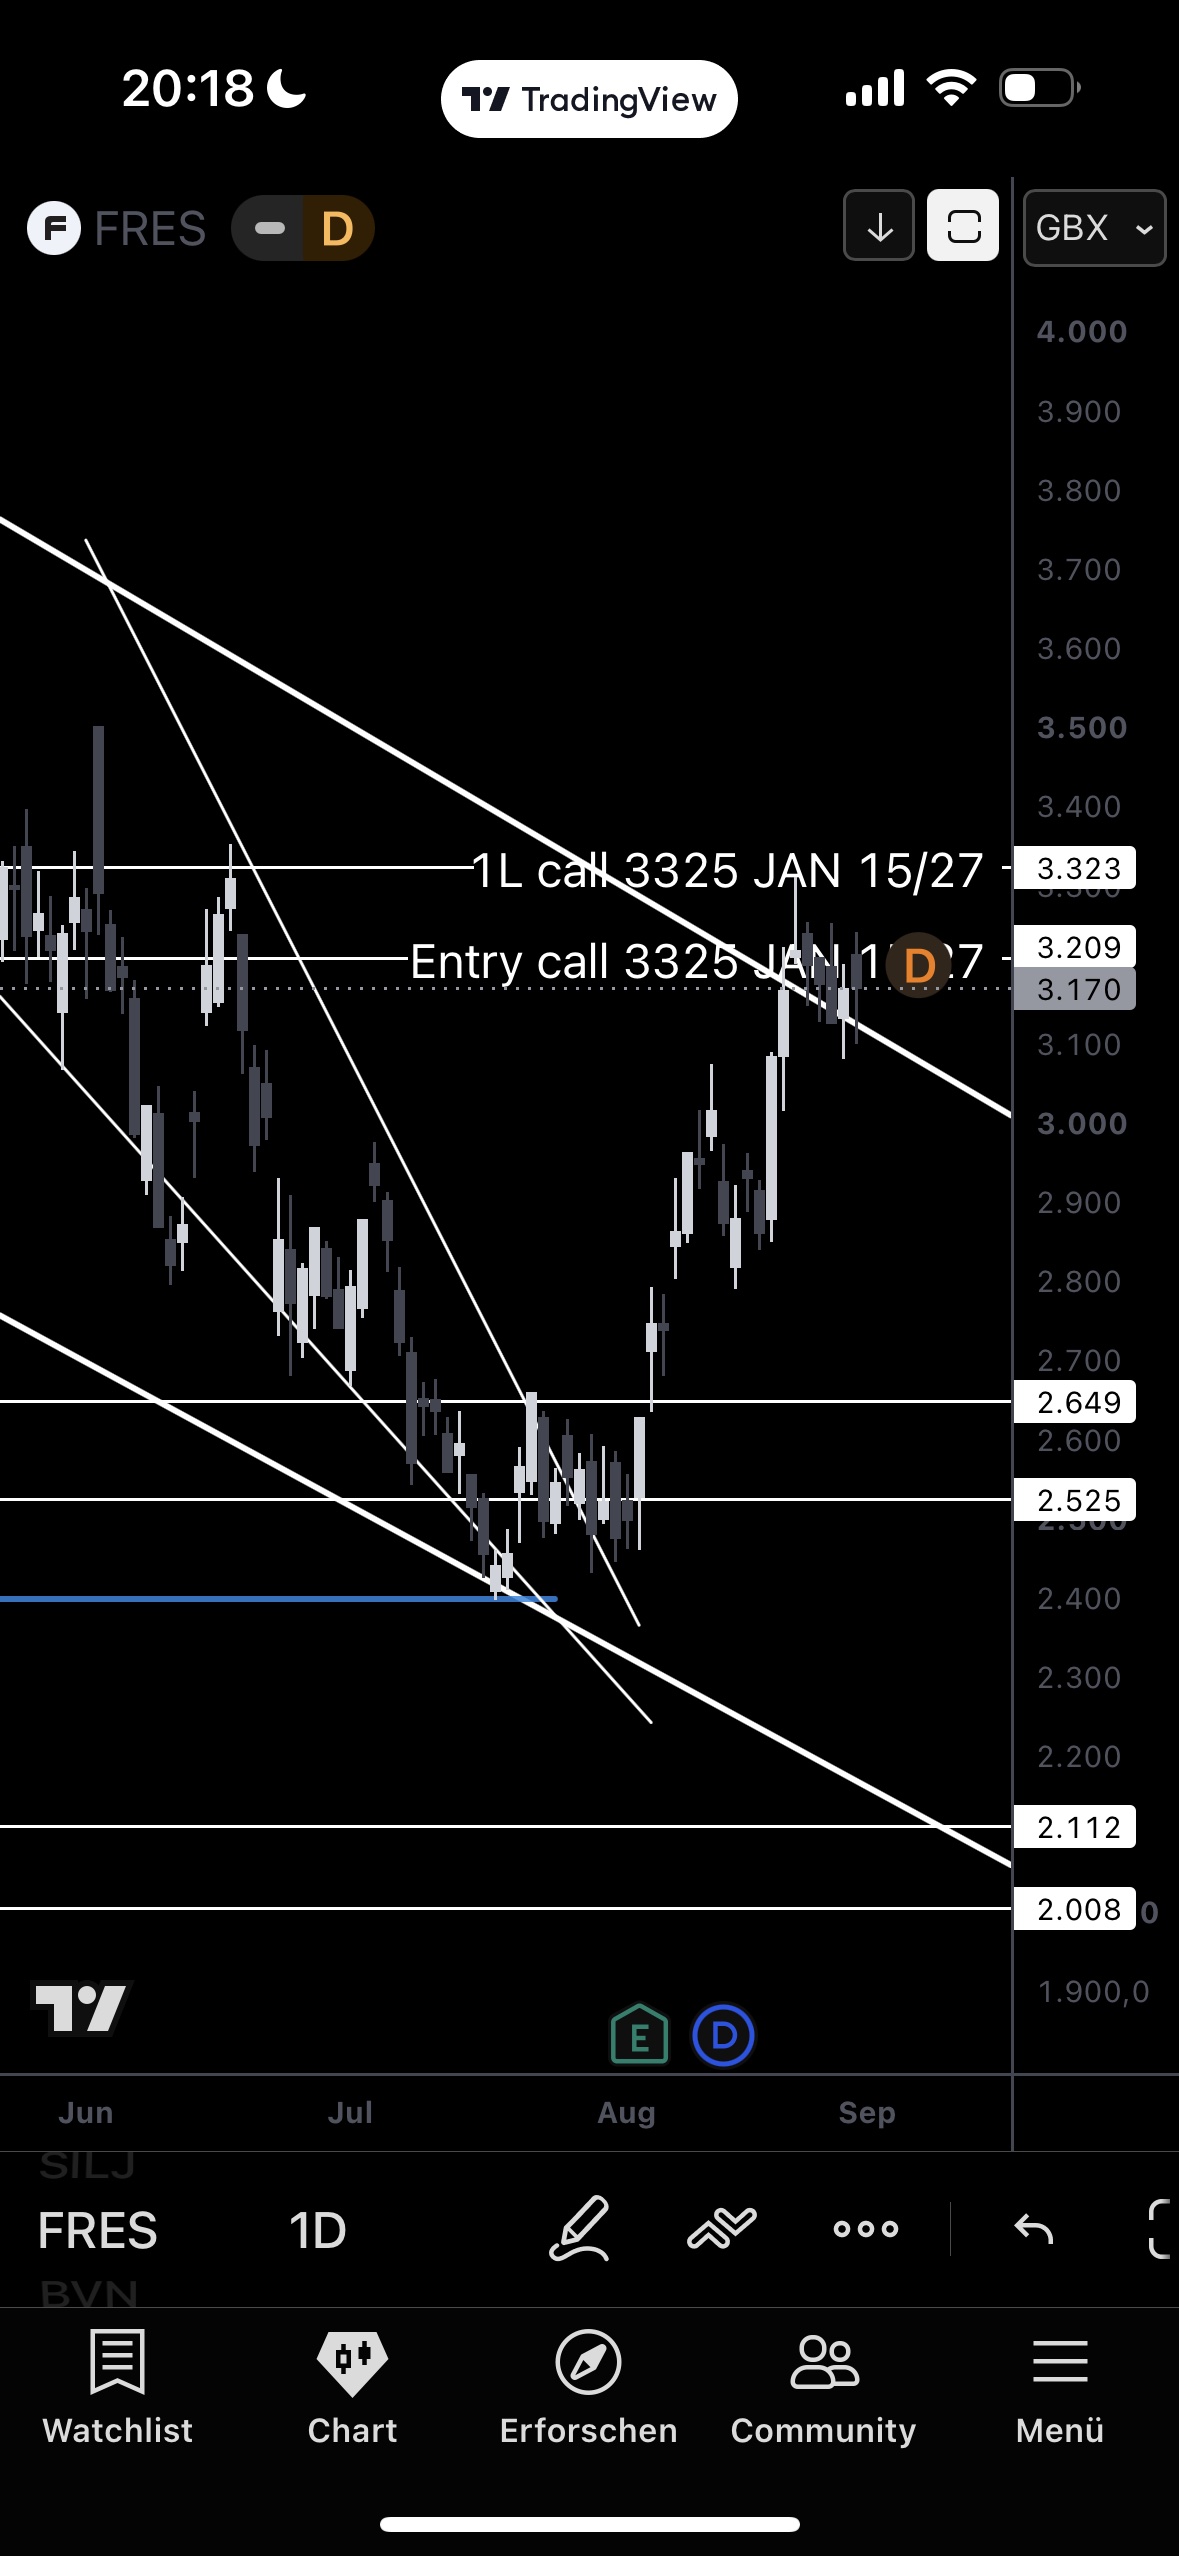
After the test of the outer wedge trendline, a double-top-like sequence: high 3,253, pullback, second attempt to 3,229 — rejected both times. Consolidating just above 3,127 / 3,105–3,110. This is the first momentum warning since the Aug 19 vertical move; no structural break, but the strike test (3,325) is taking its time. Bullish on a sustained close > 3,253; warning on a third rejection plus a break < 3,069 → pullback toward 2,975/2,954. A separate decision in the exit plan (keep the ticket vs. loss-cut): even the 3,800–4,000 GBX target zone brings the 3325C only marginally above cost.
Gold.com: spike-through, then reversal.
1D
4H
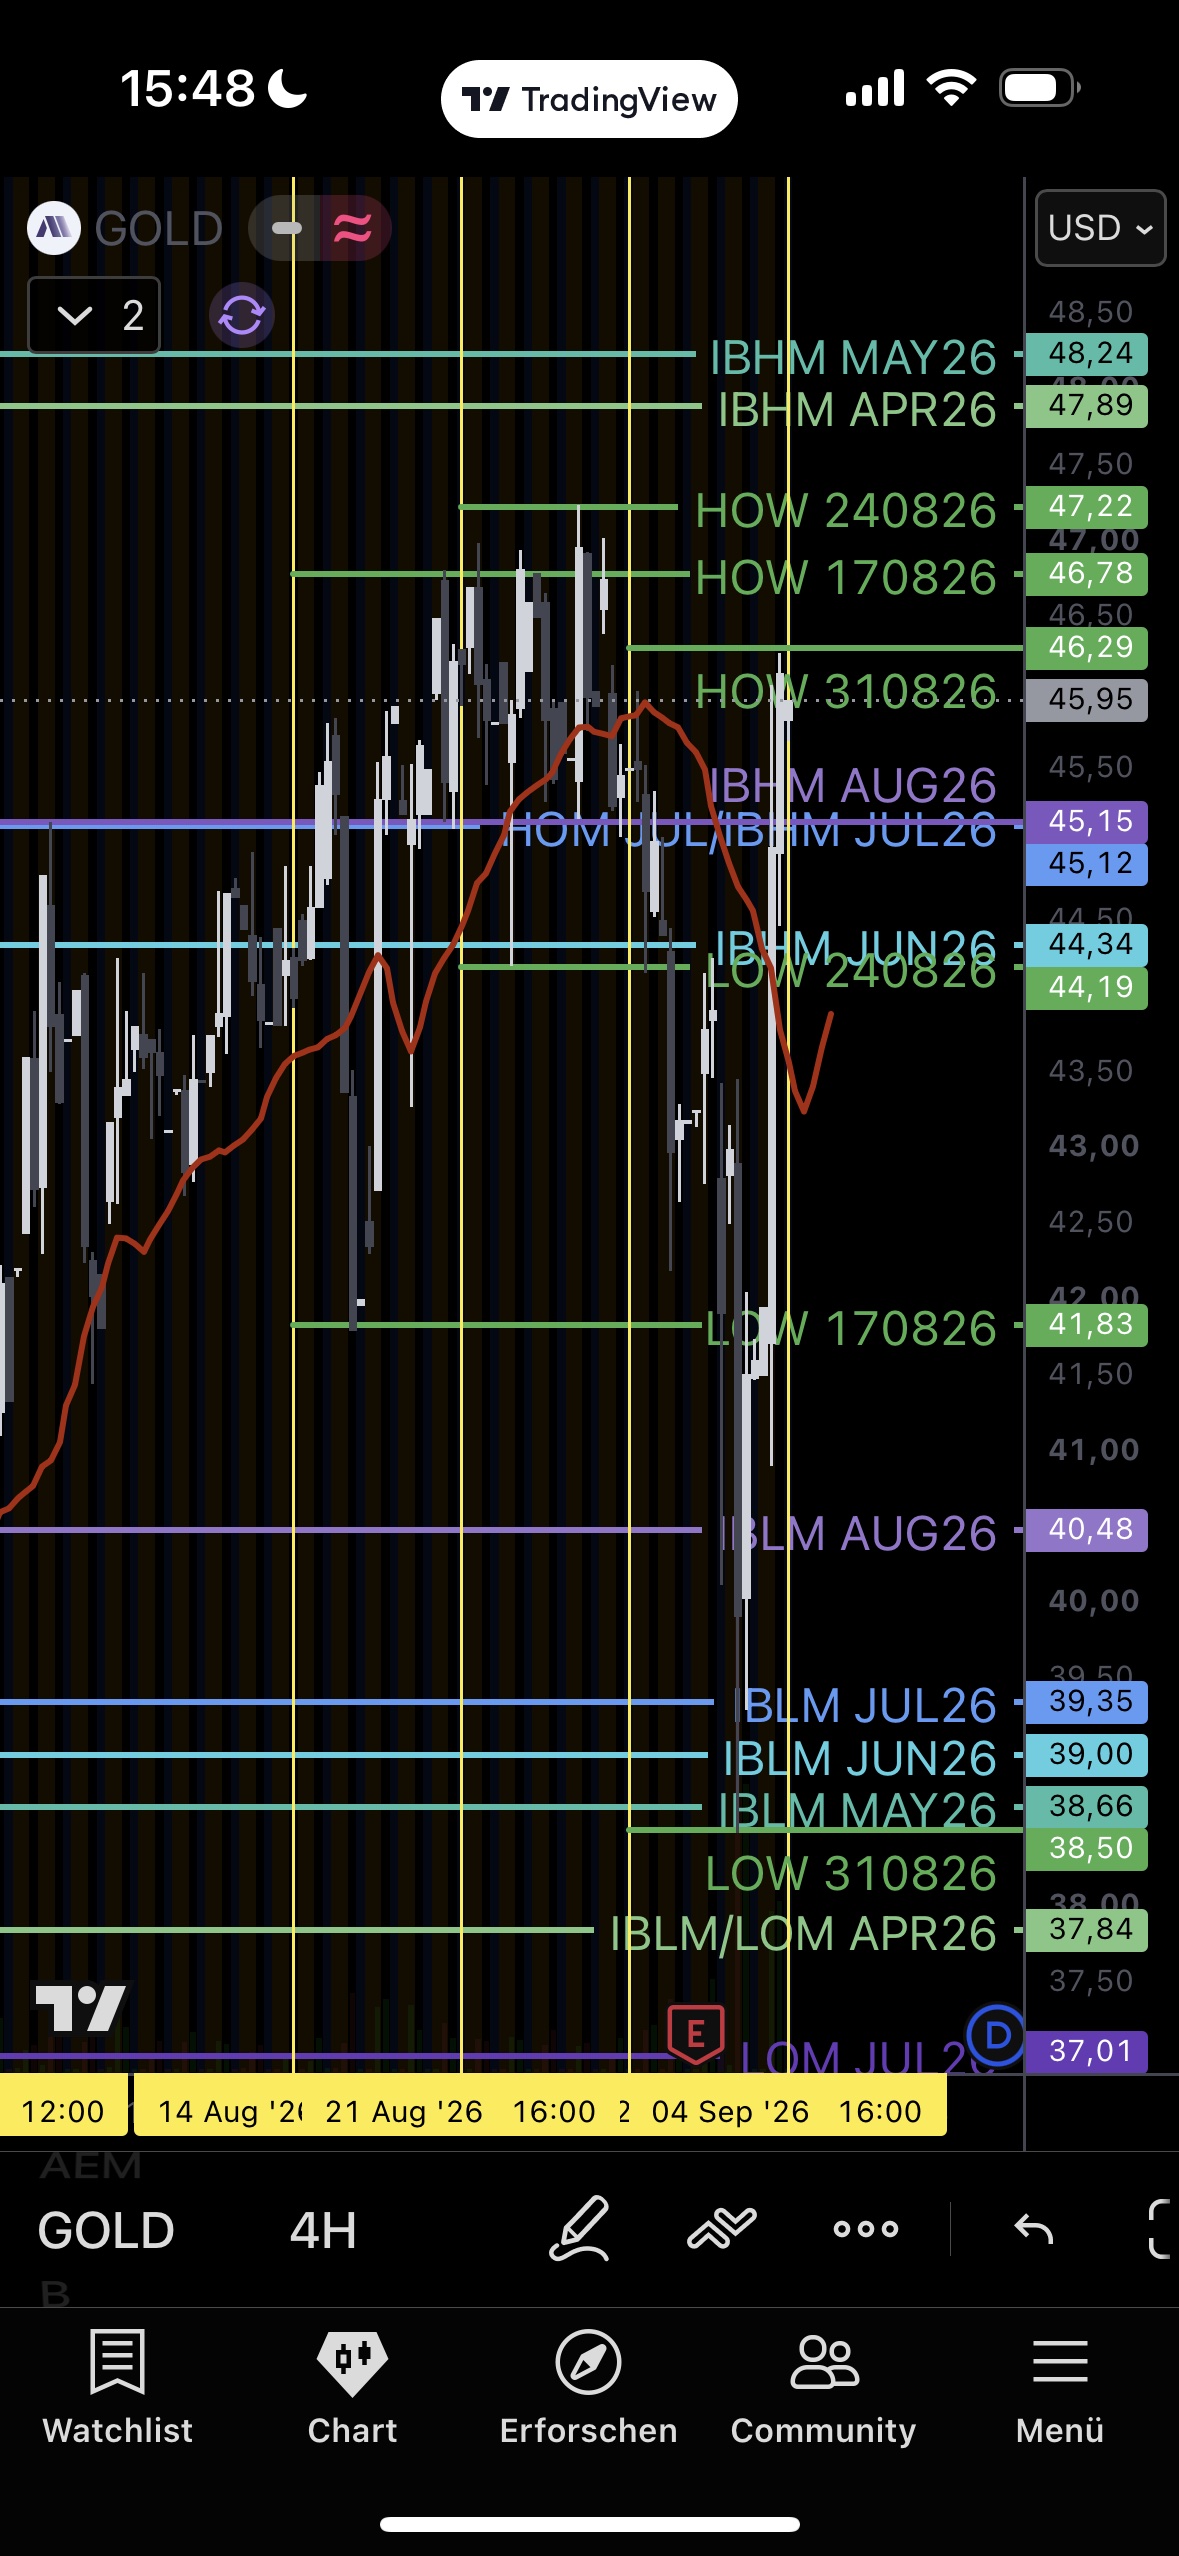
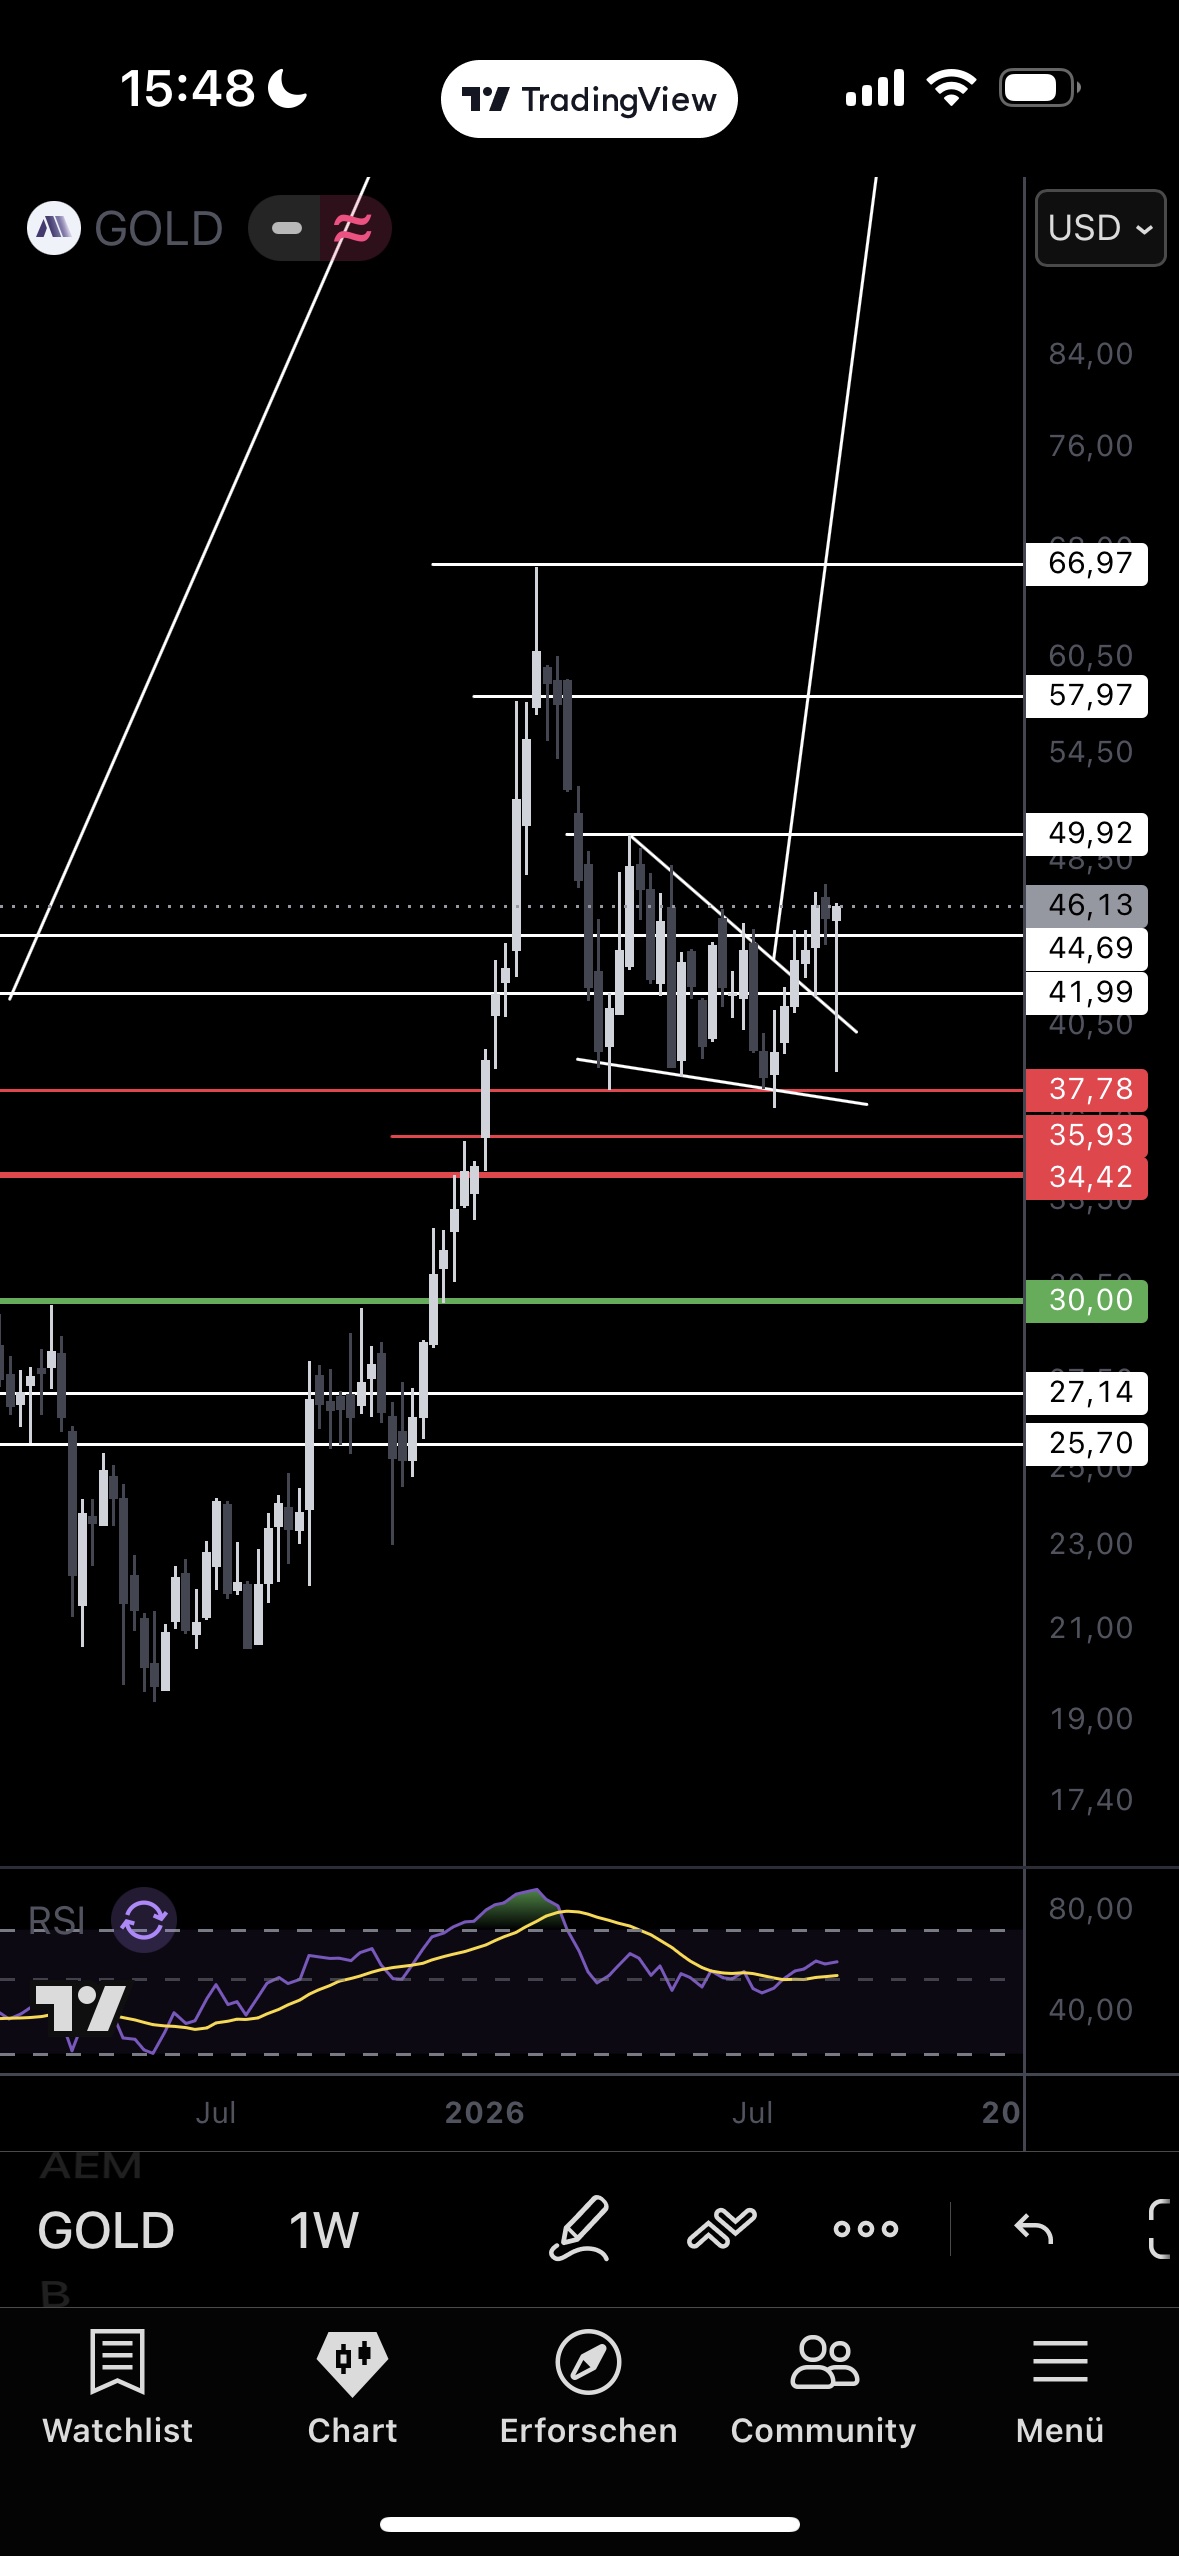
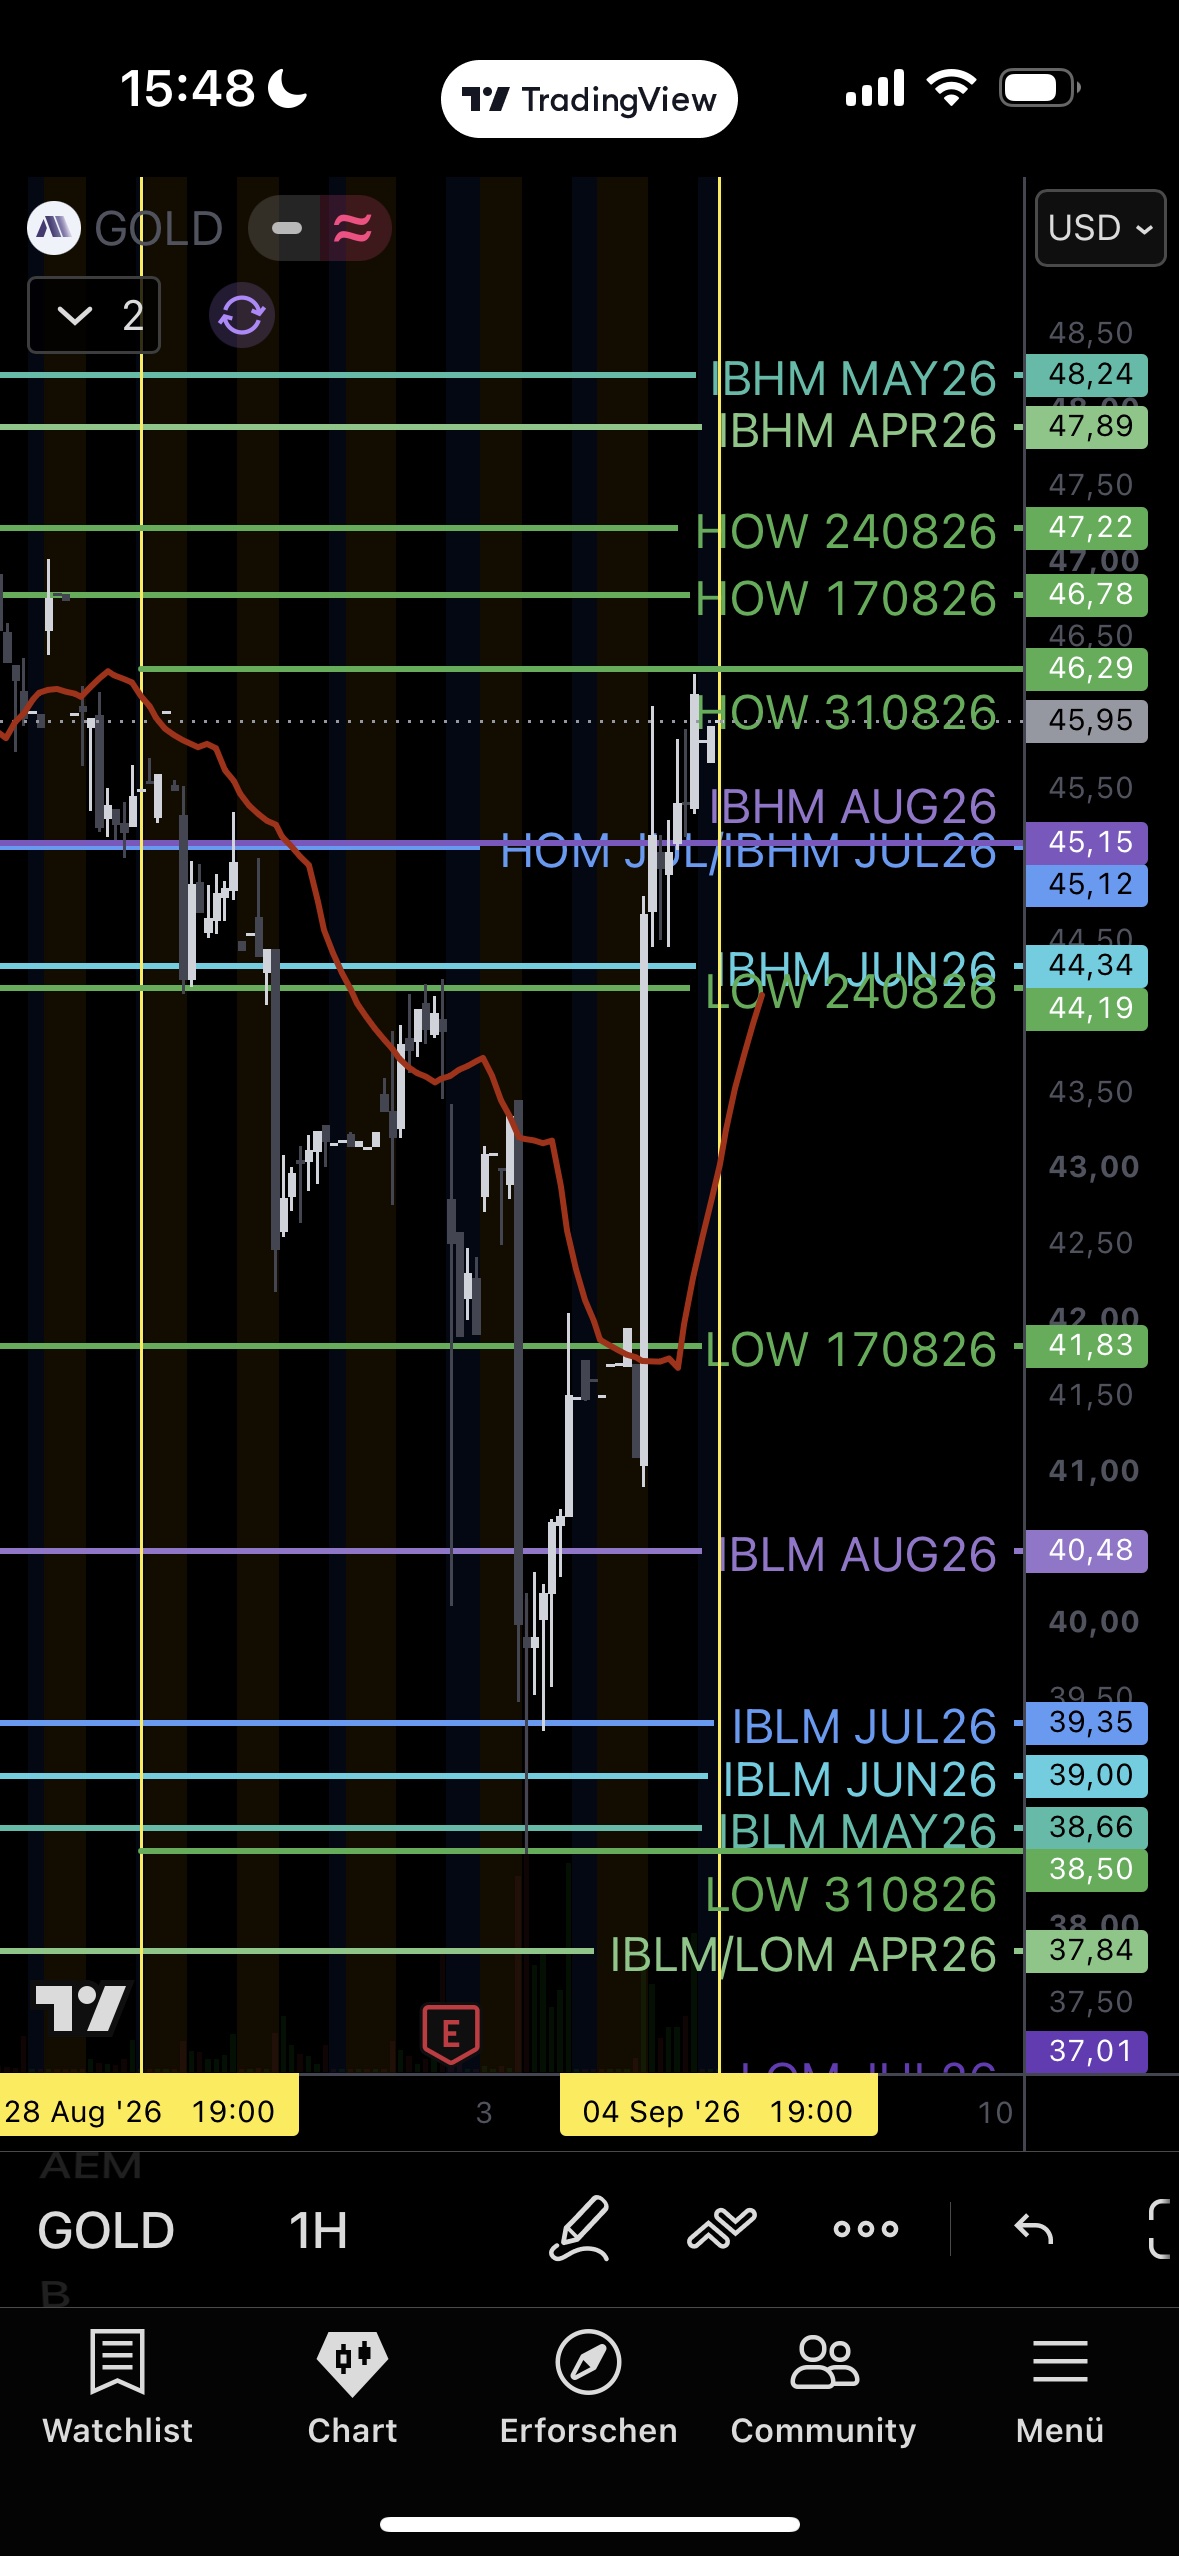
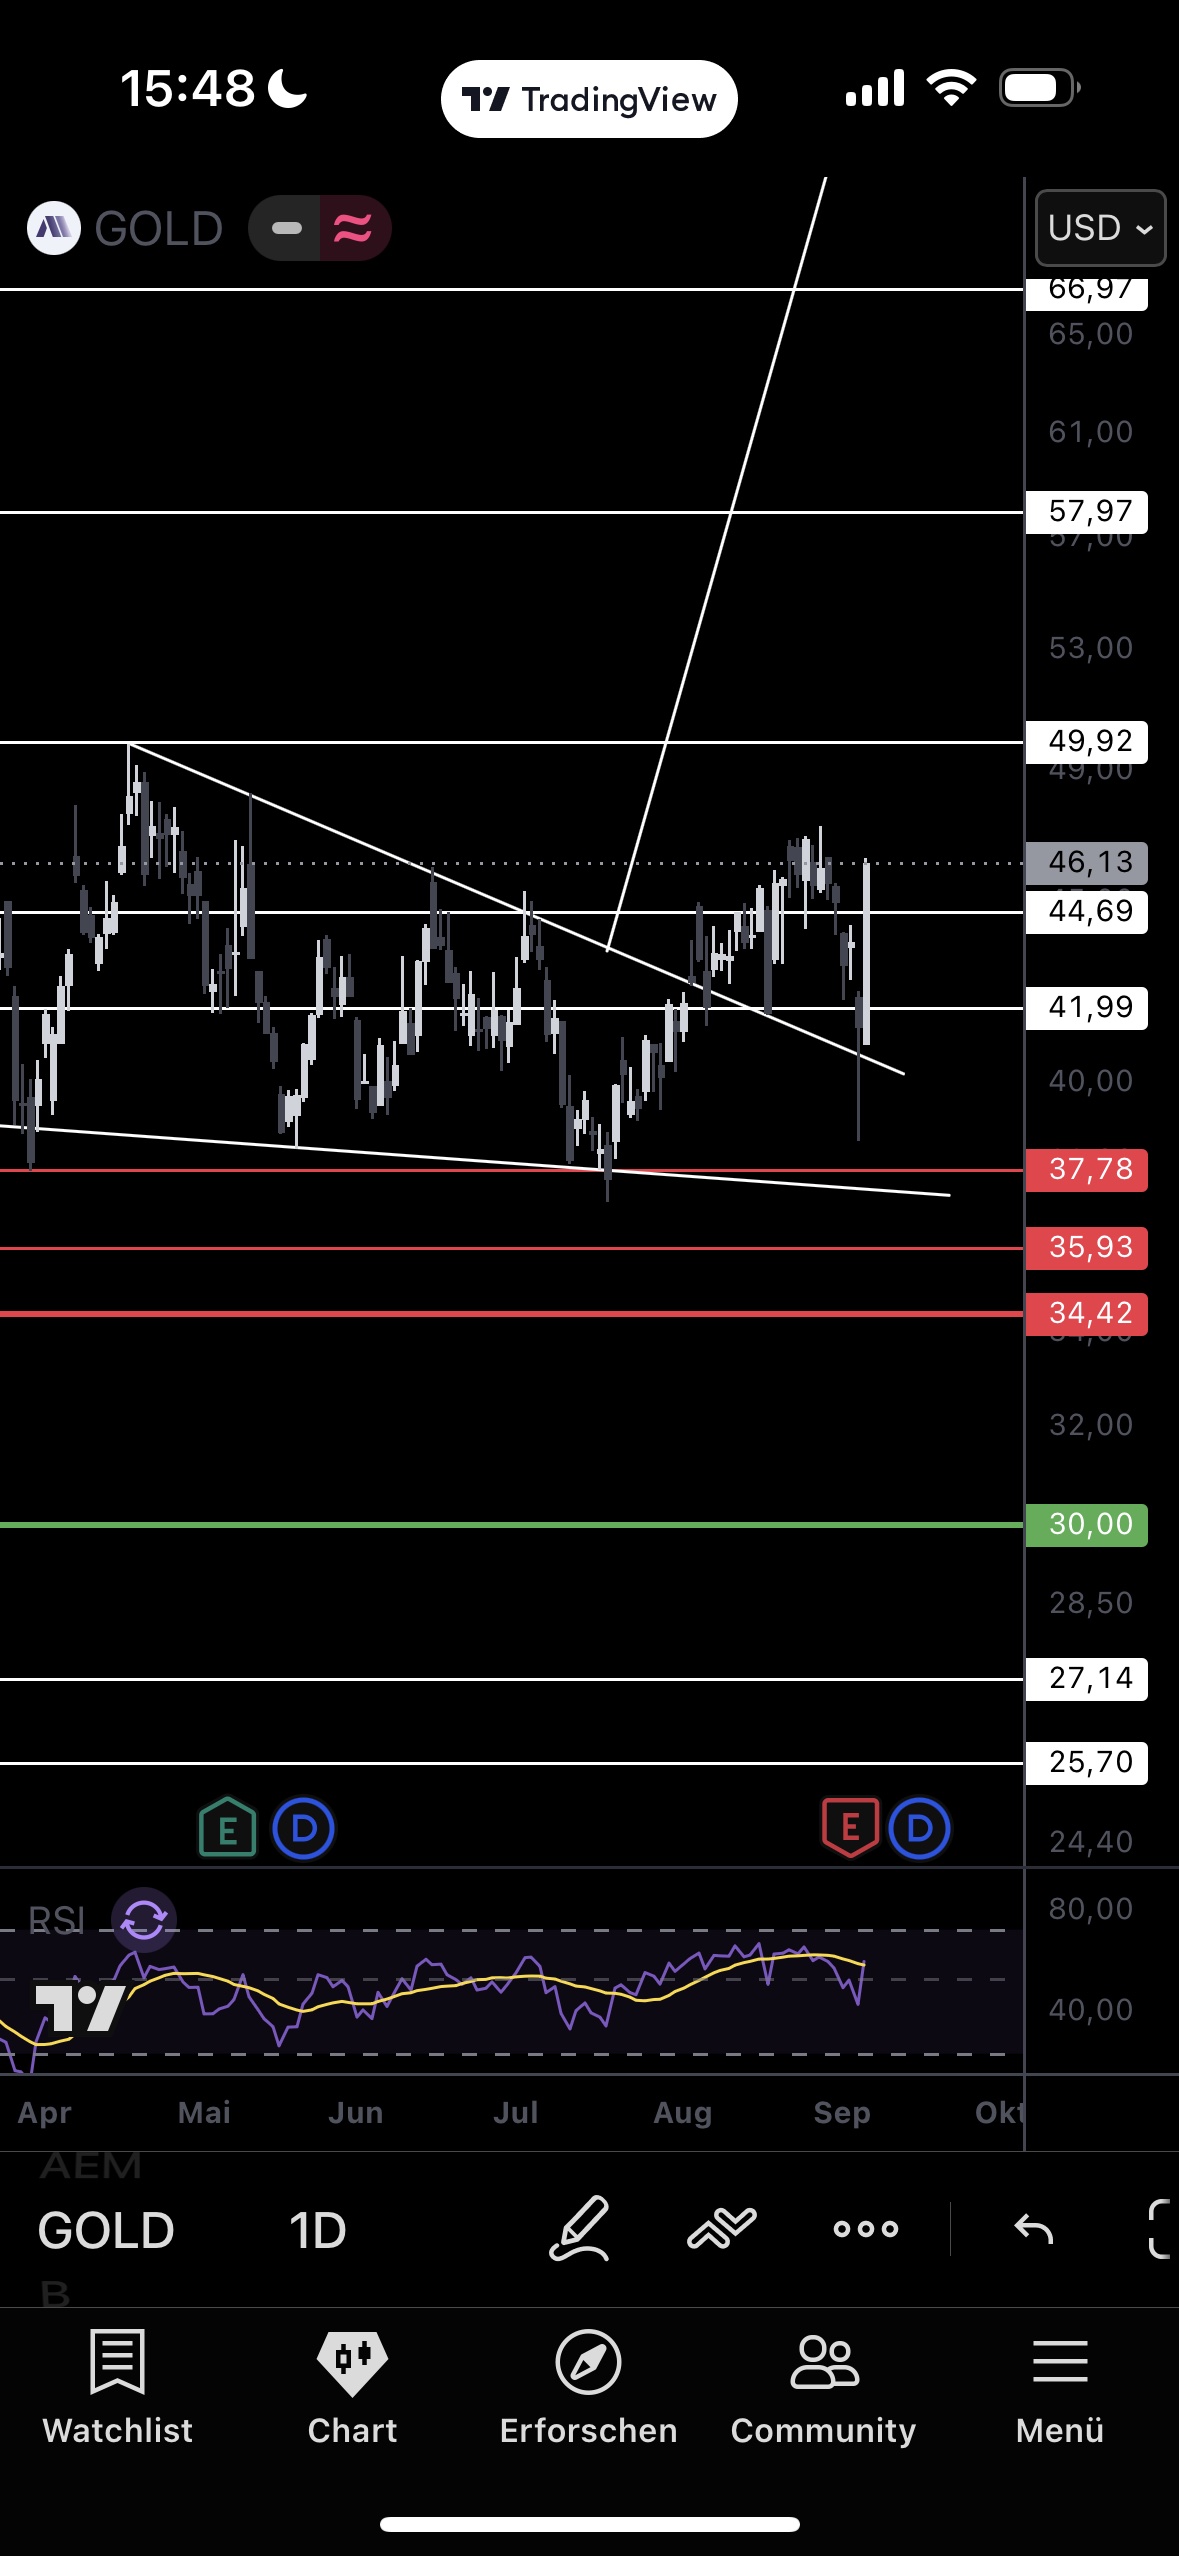
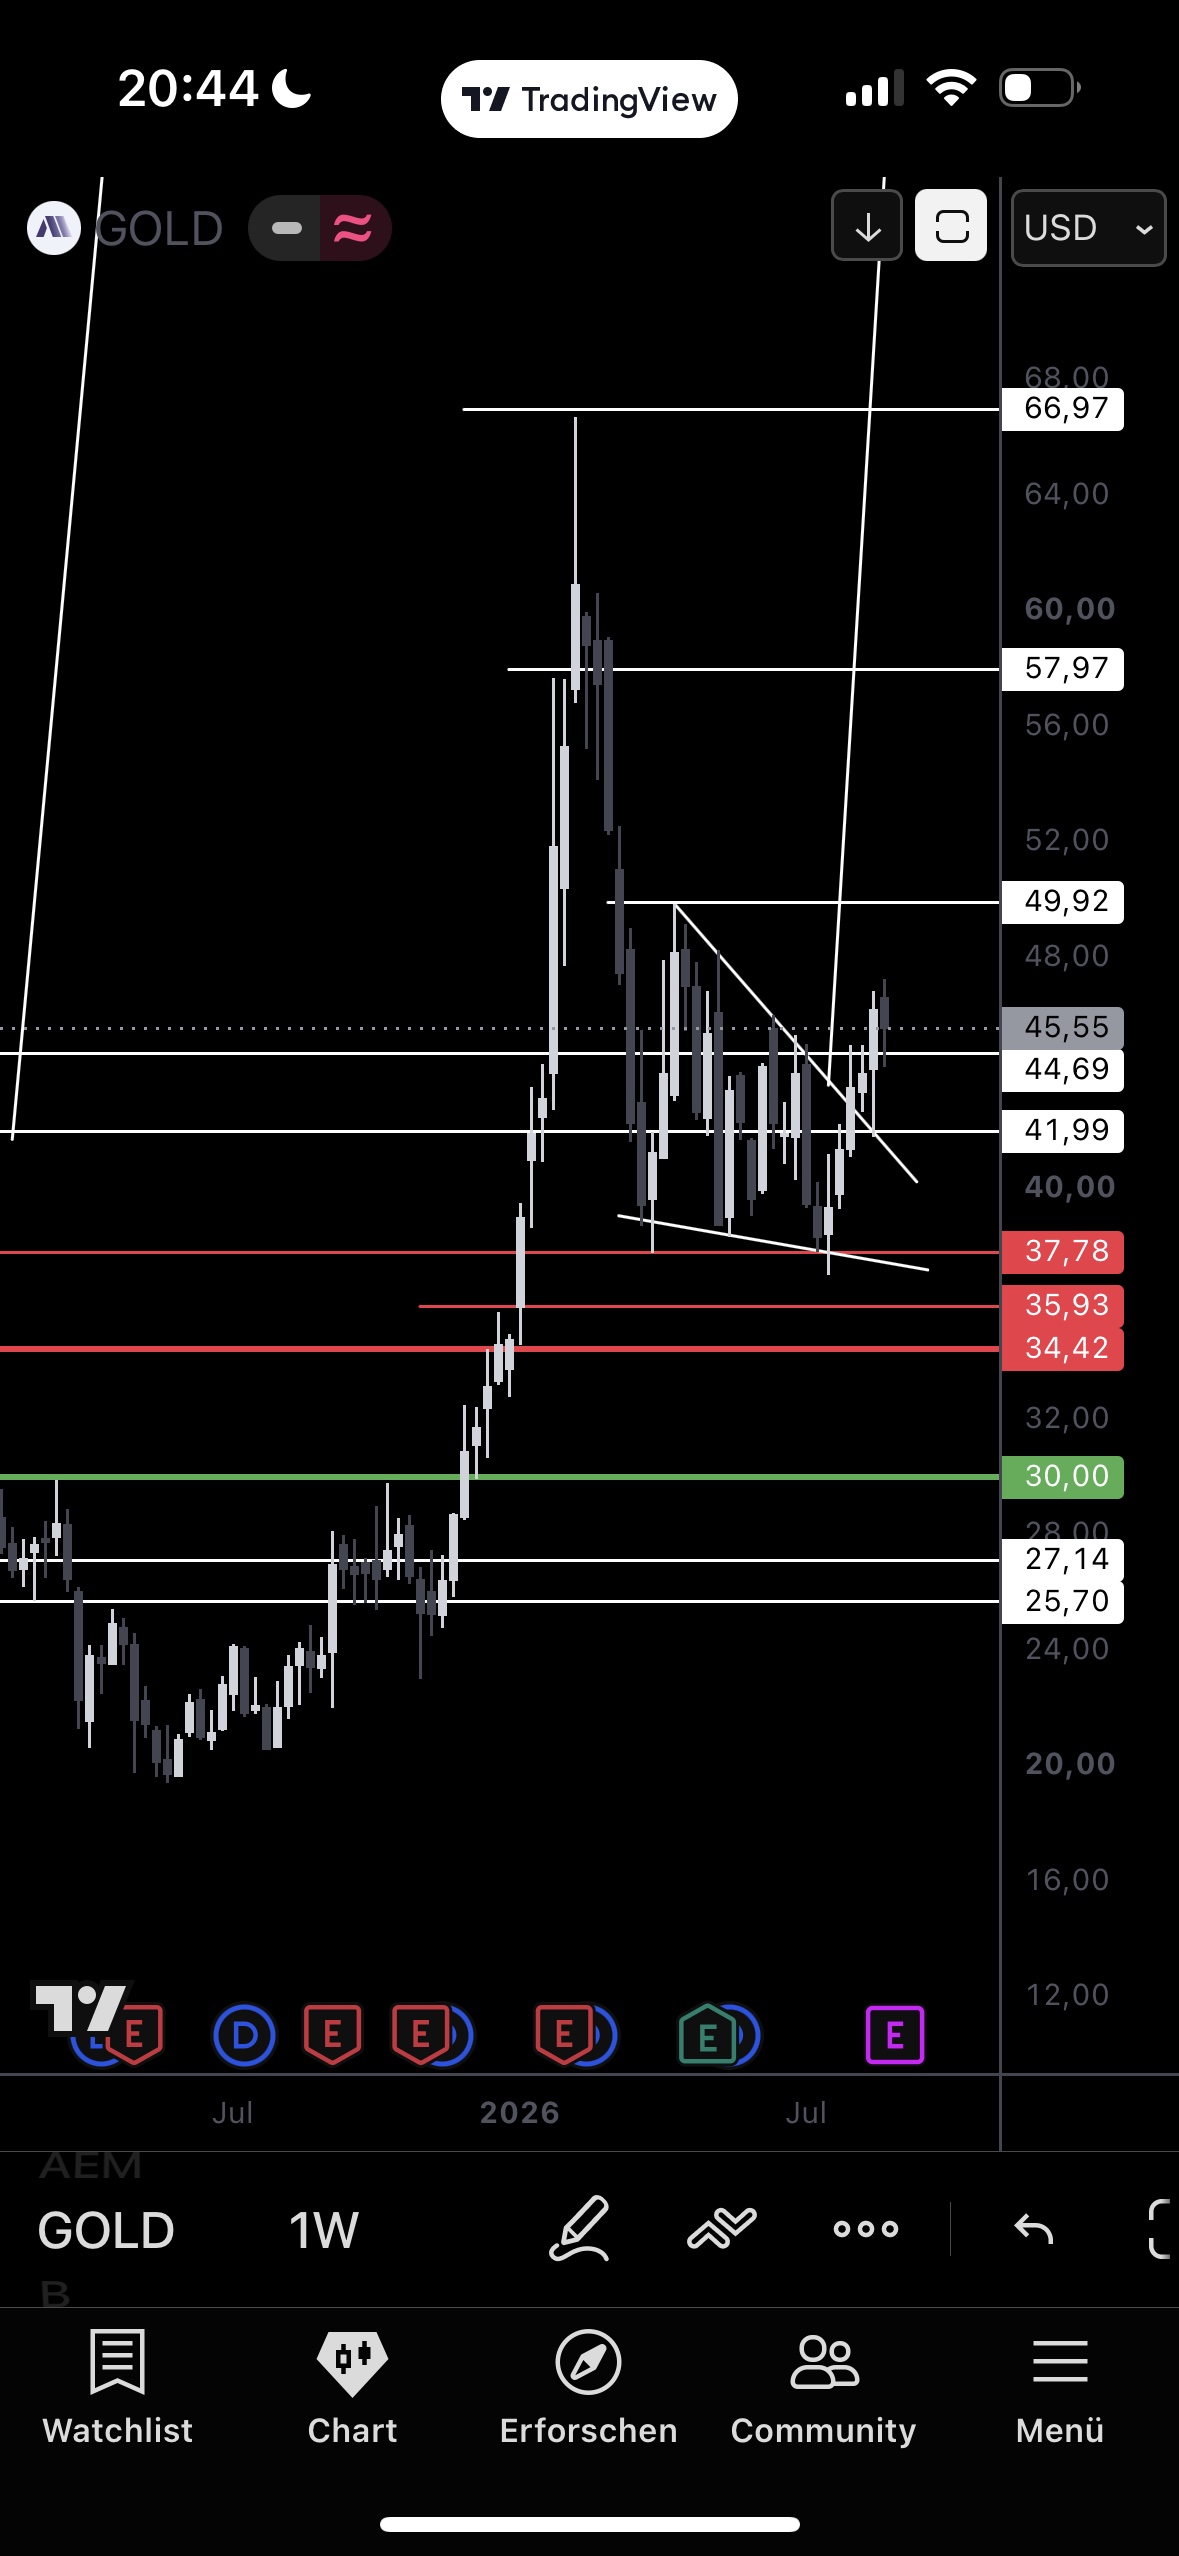
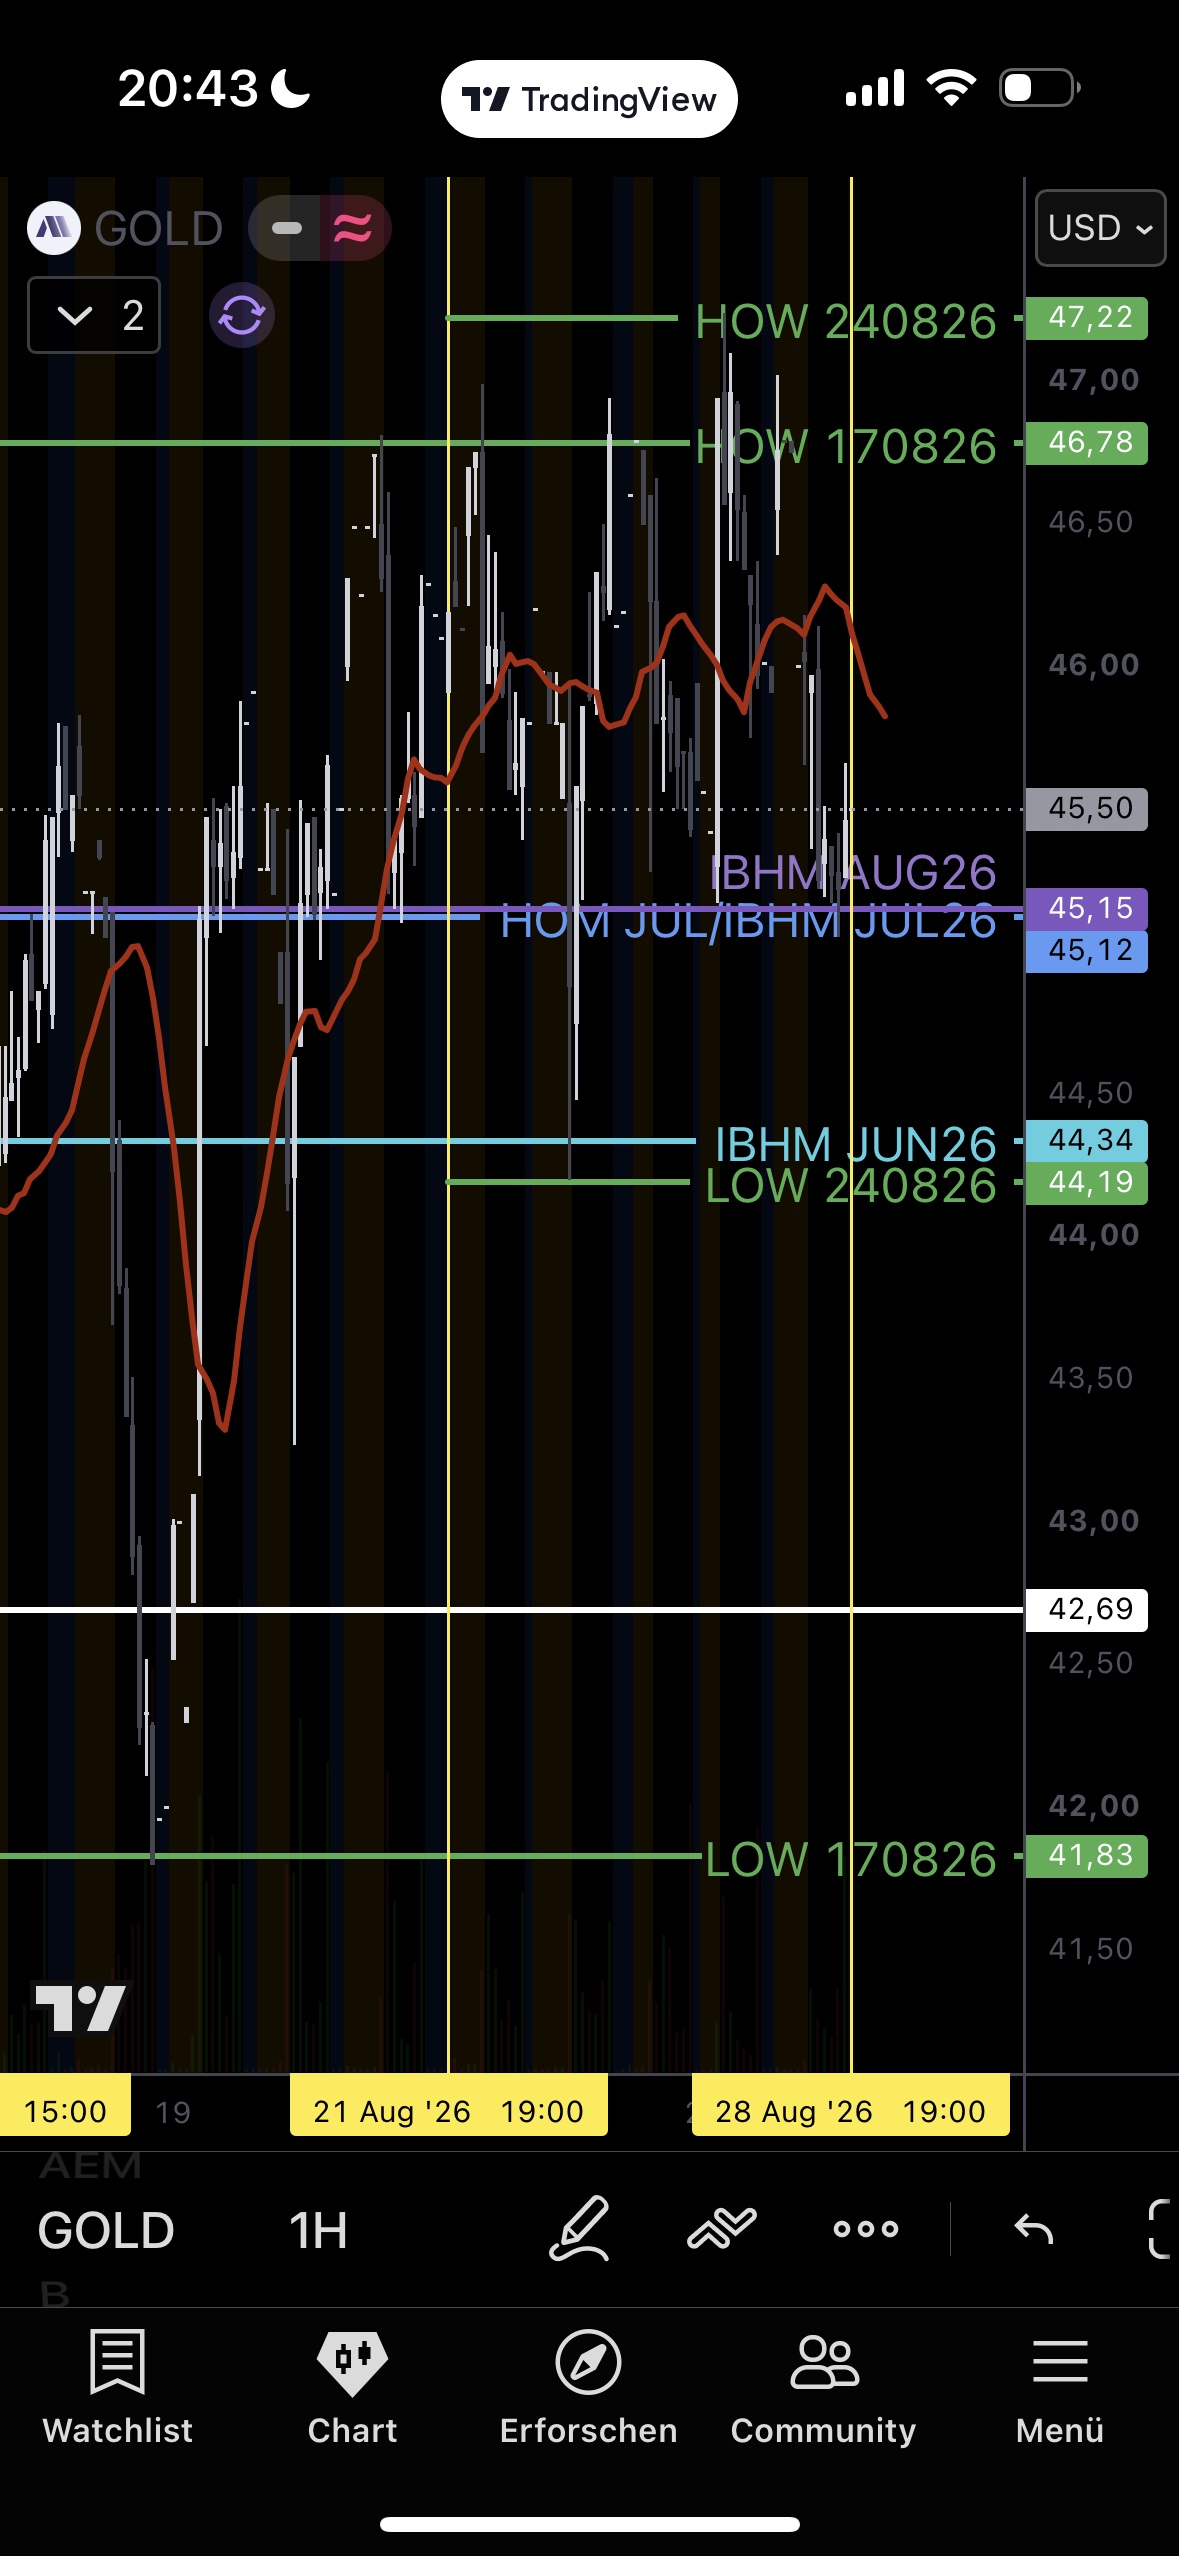
A much more volatile week: first a lower weekly high (46.29 vs. 47.22) as a first momentum warning, then a sharp flush through the 44.34 invalidation zone down to 41.83, followed by a V-shaped recovery back to 46.13. Textbook spike-through-then-reversal on the support cluster — liquidity gets taken below the cluster, then reversal; structurally held. Counter-view: a lower high plus sharper volatility could be early distribution. Invalidation now moved to a close < 41.83. MAR27 50C (2L), OTM ~7.7% — best recovery of the week.
Kennametal: the third attempt has force.
1D
4H
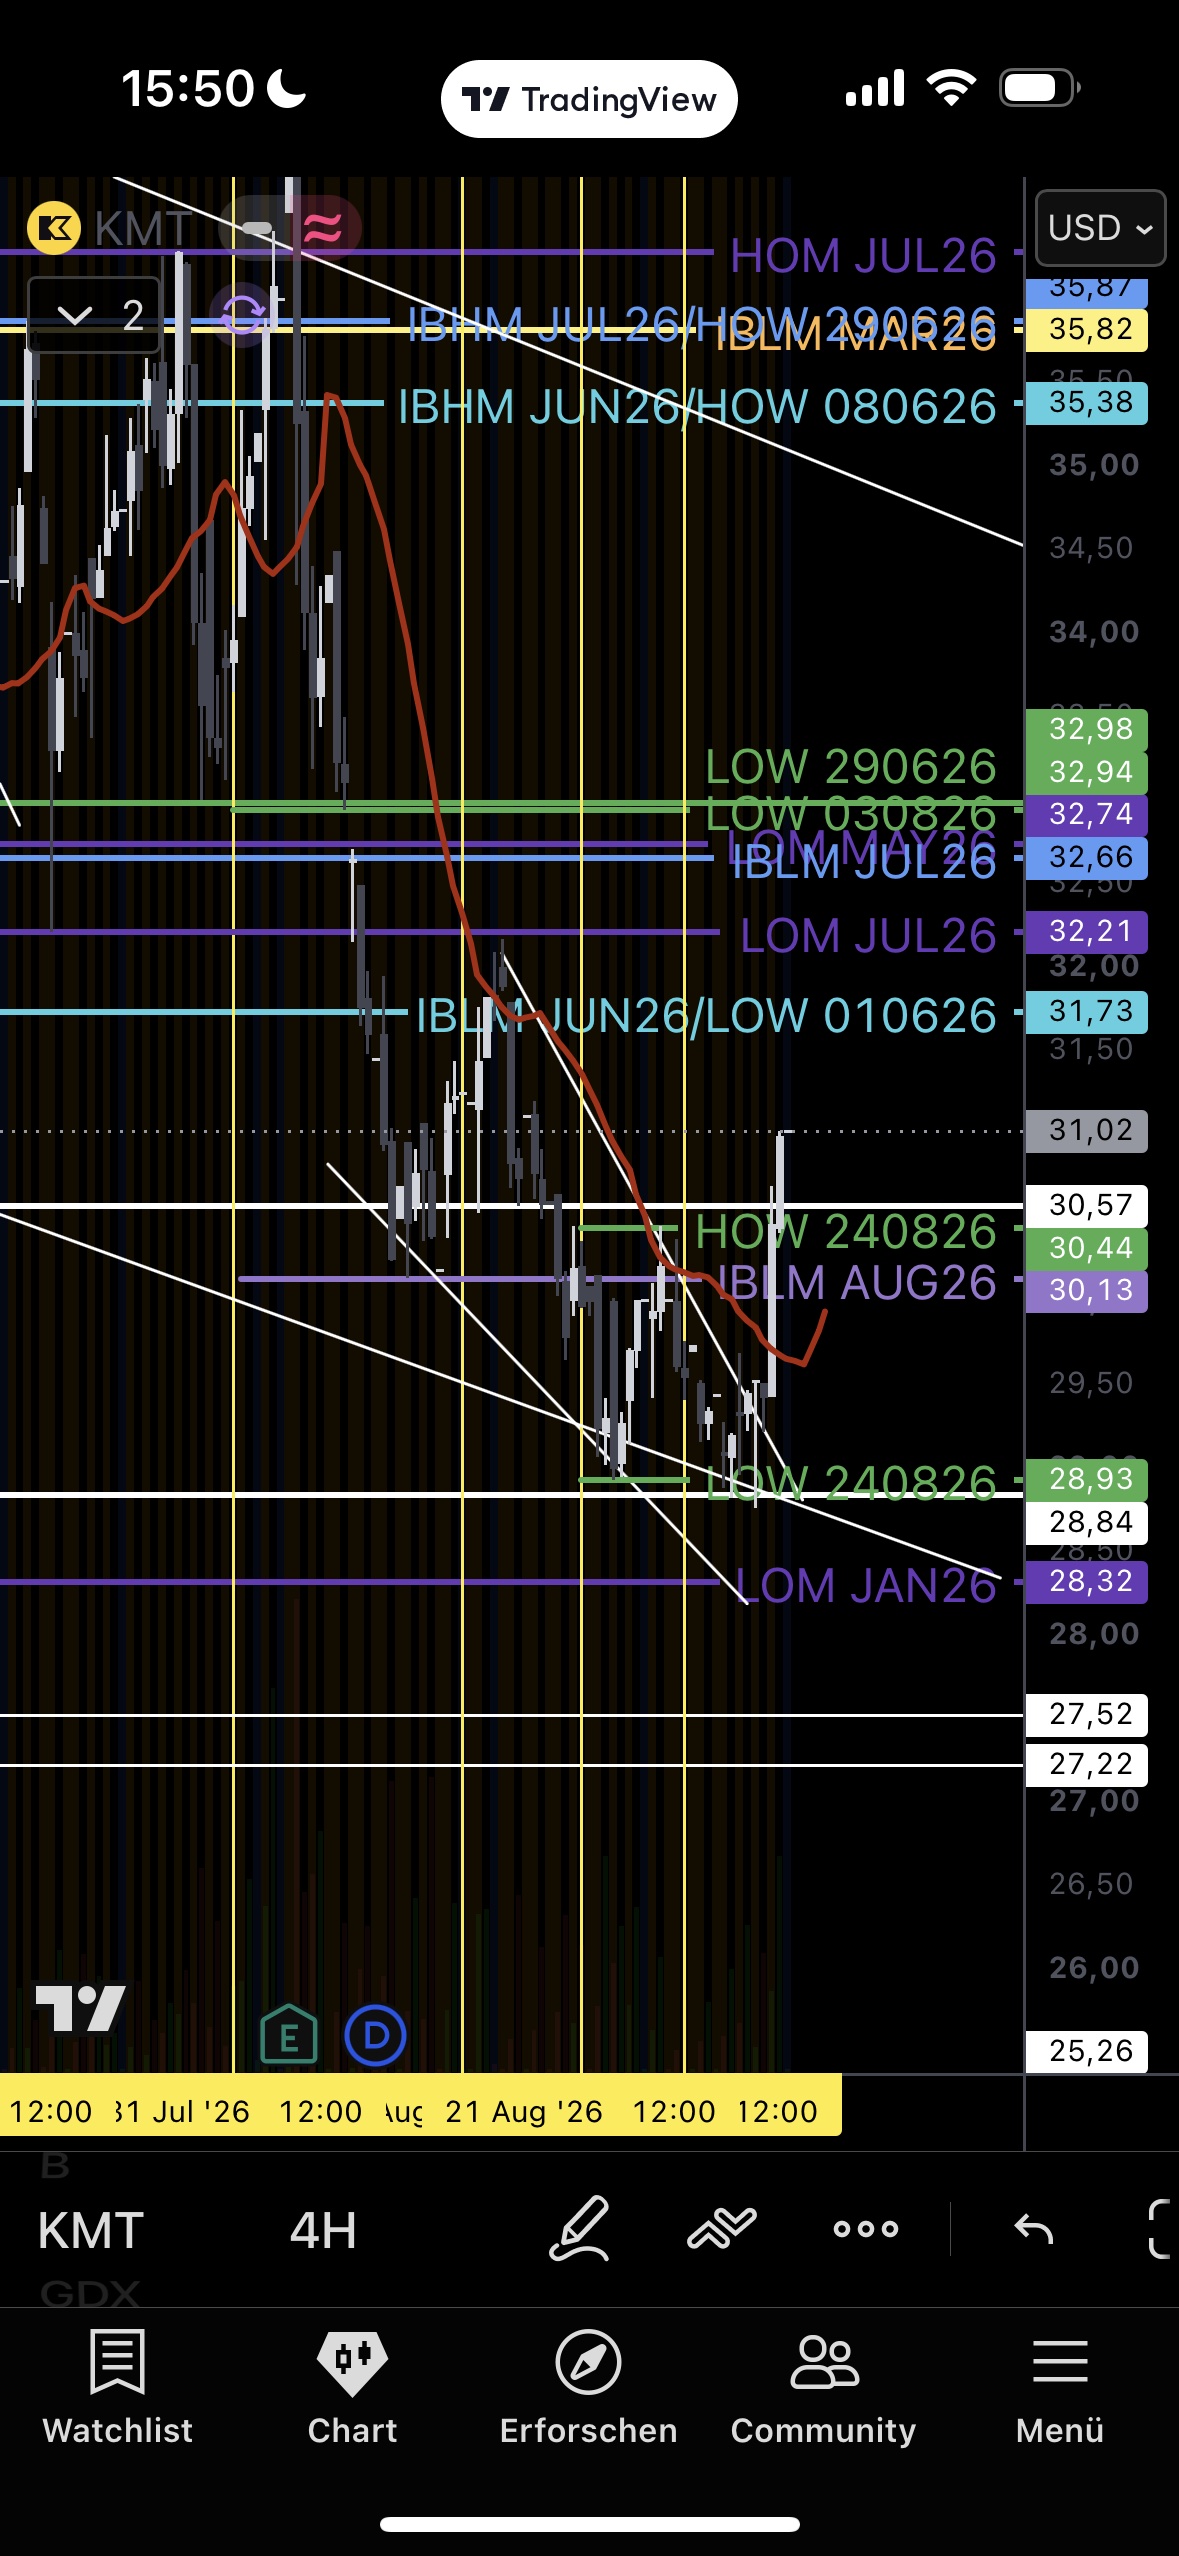
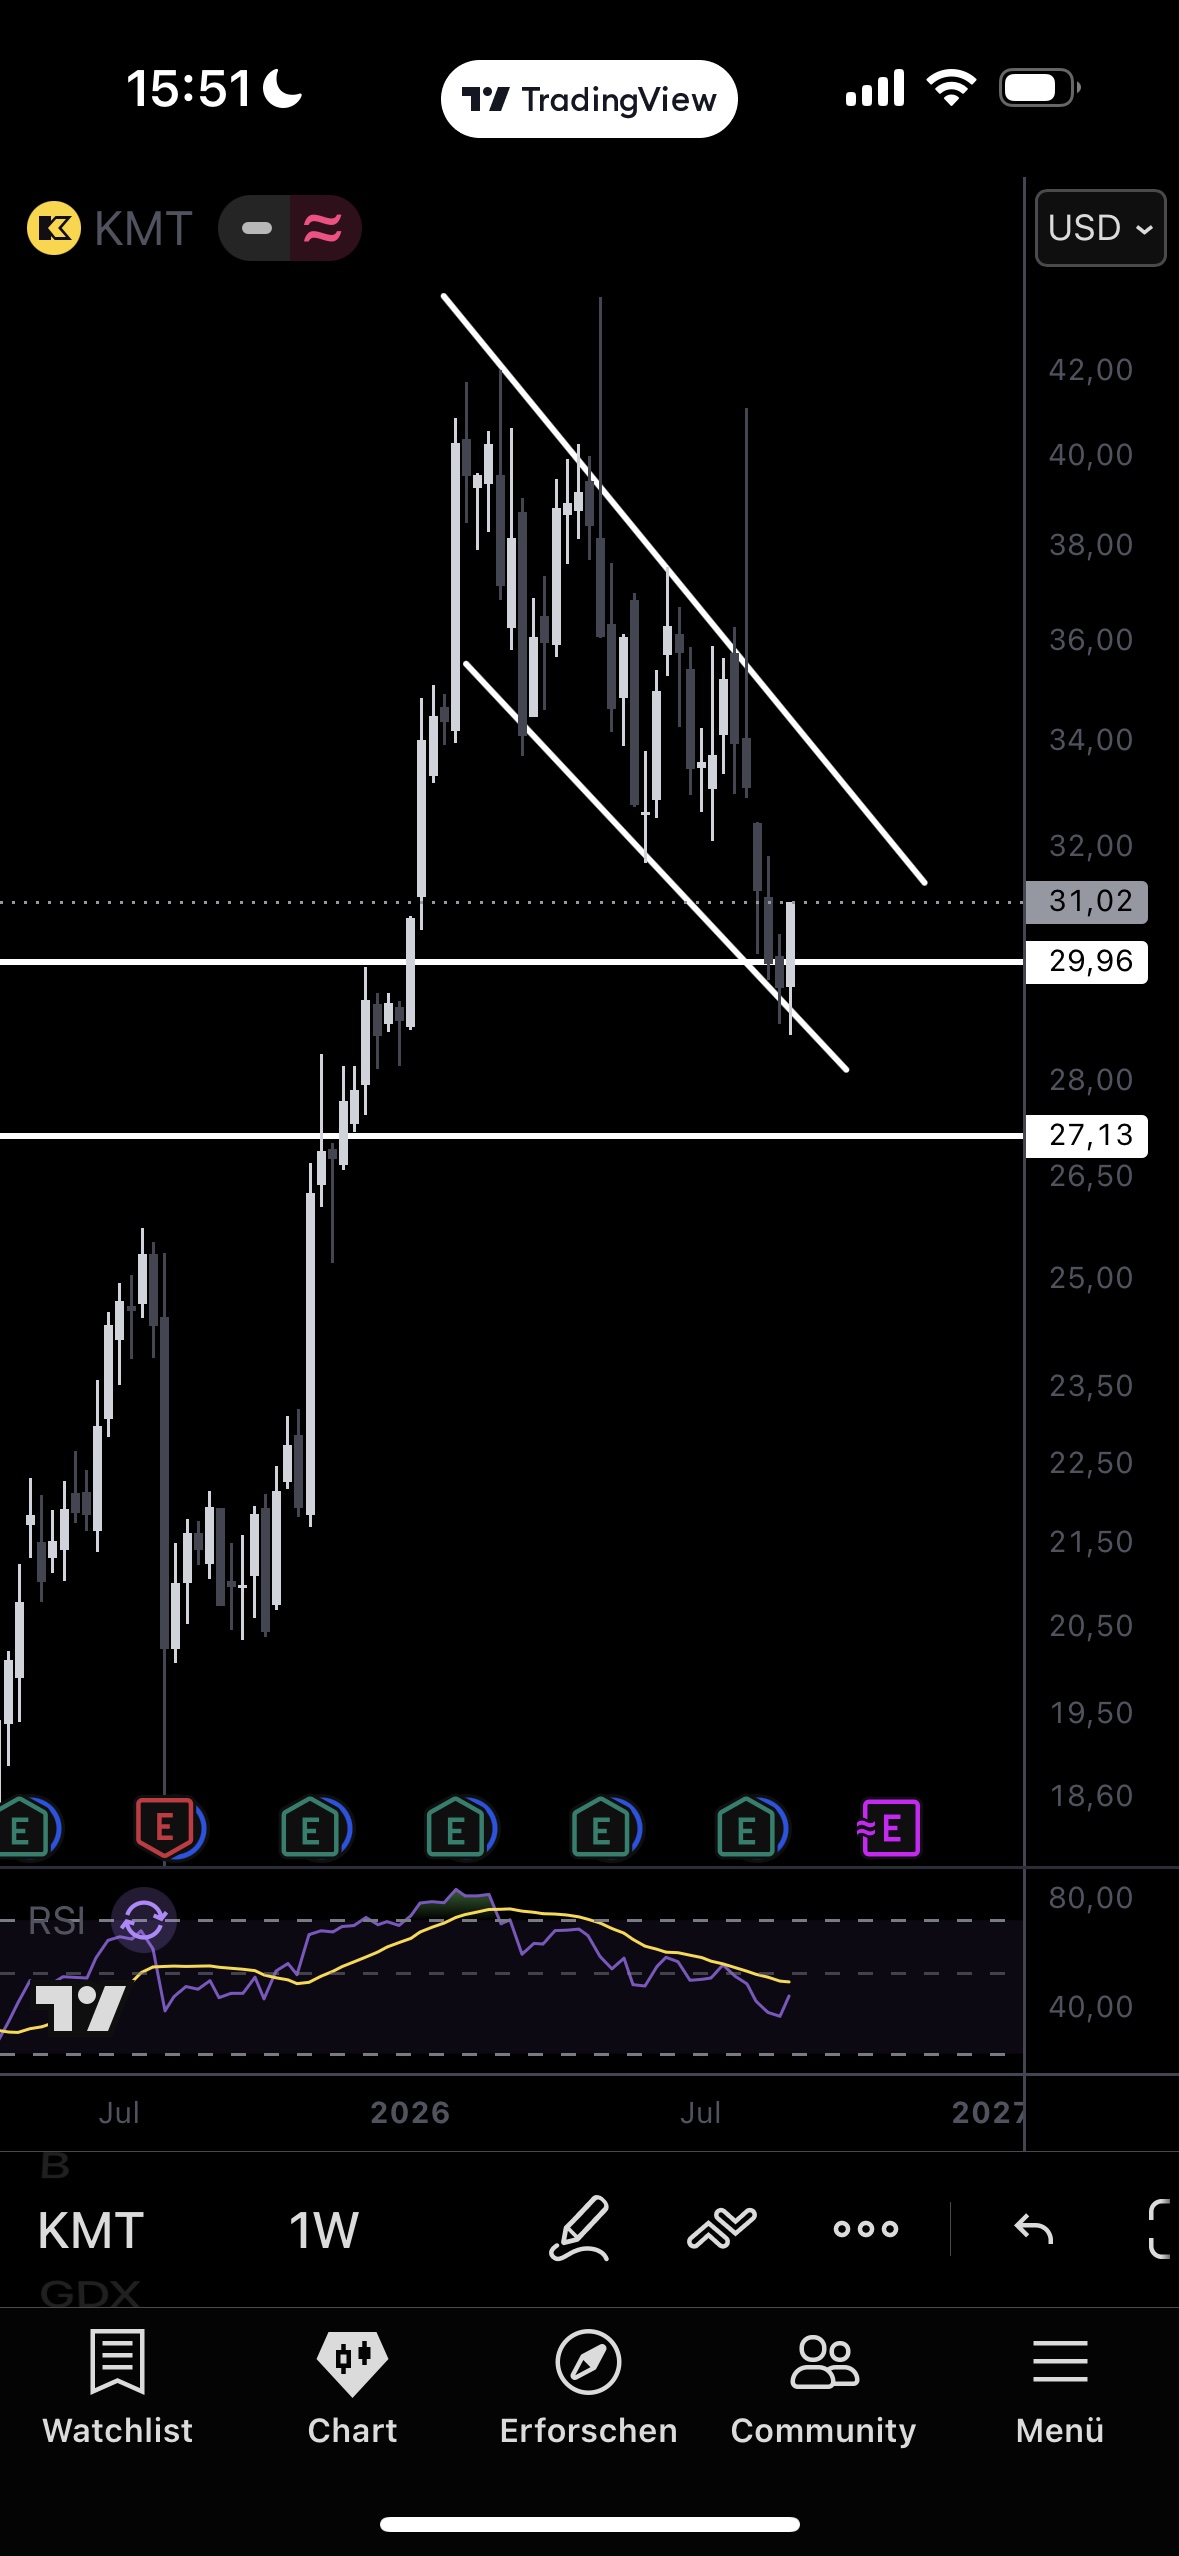
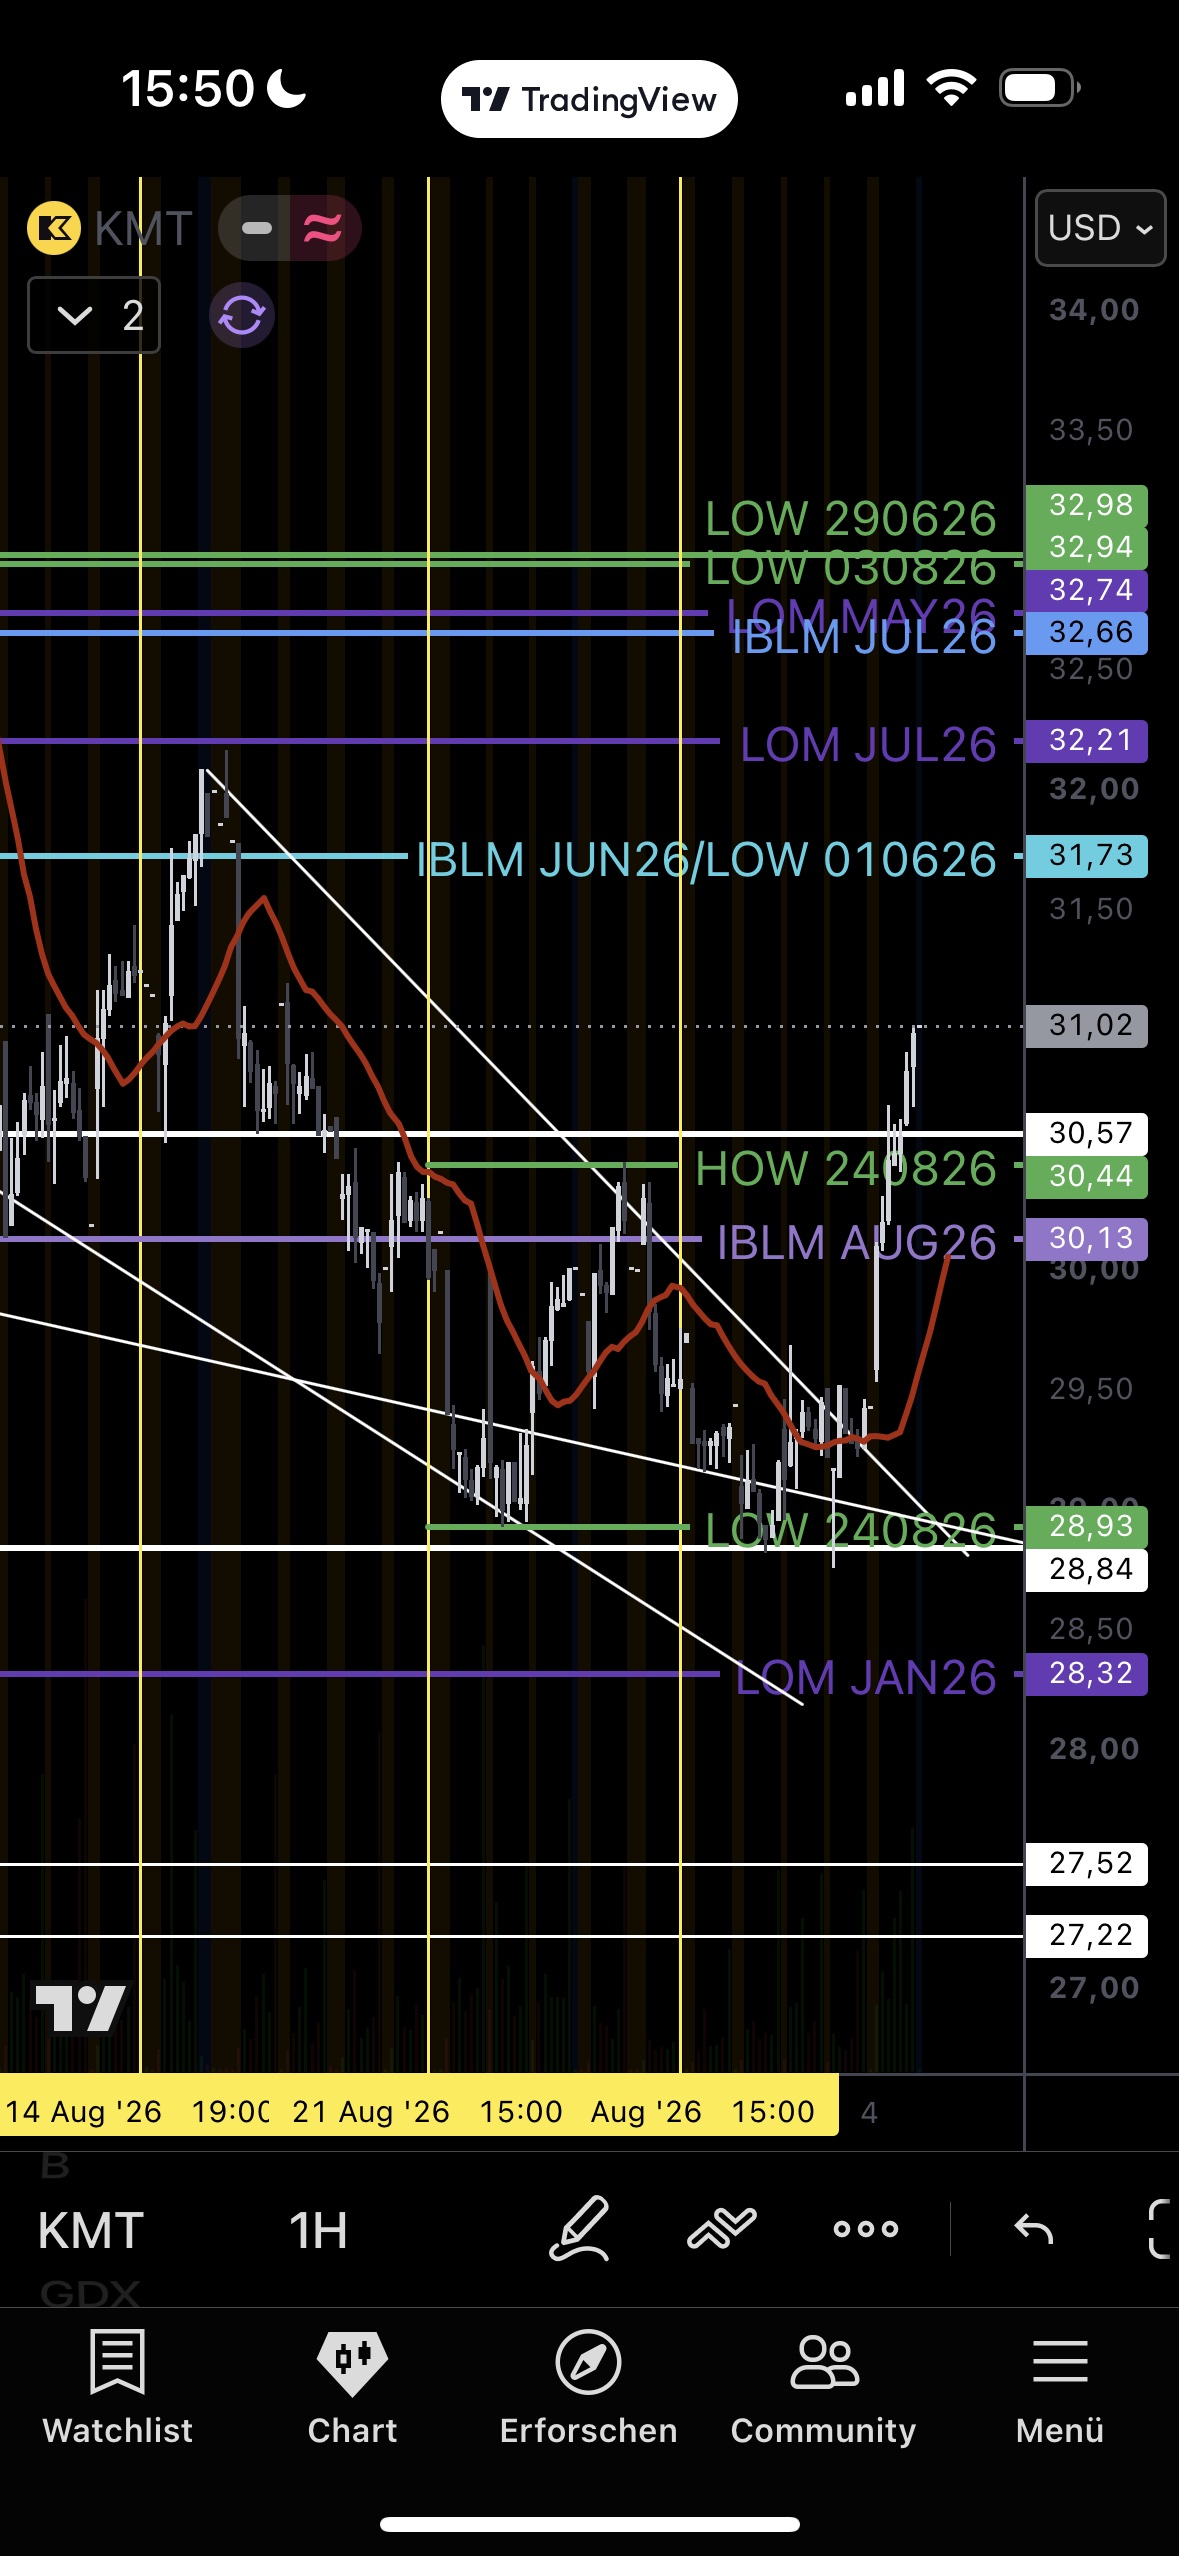
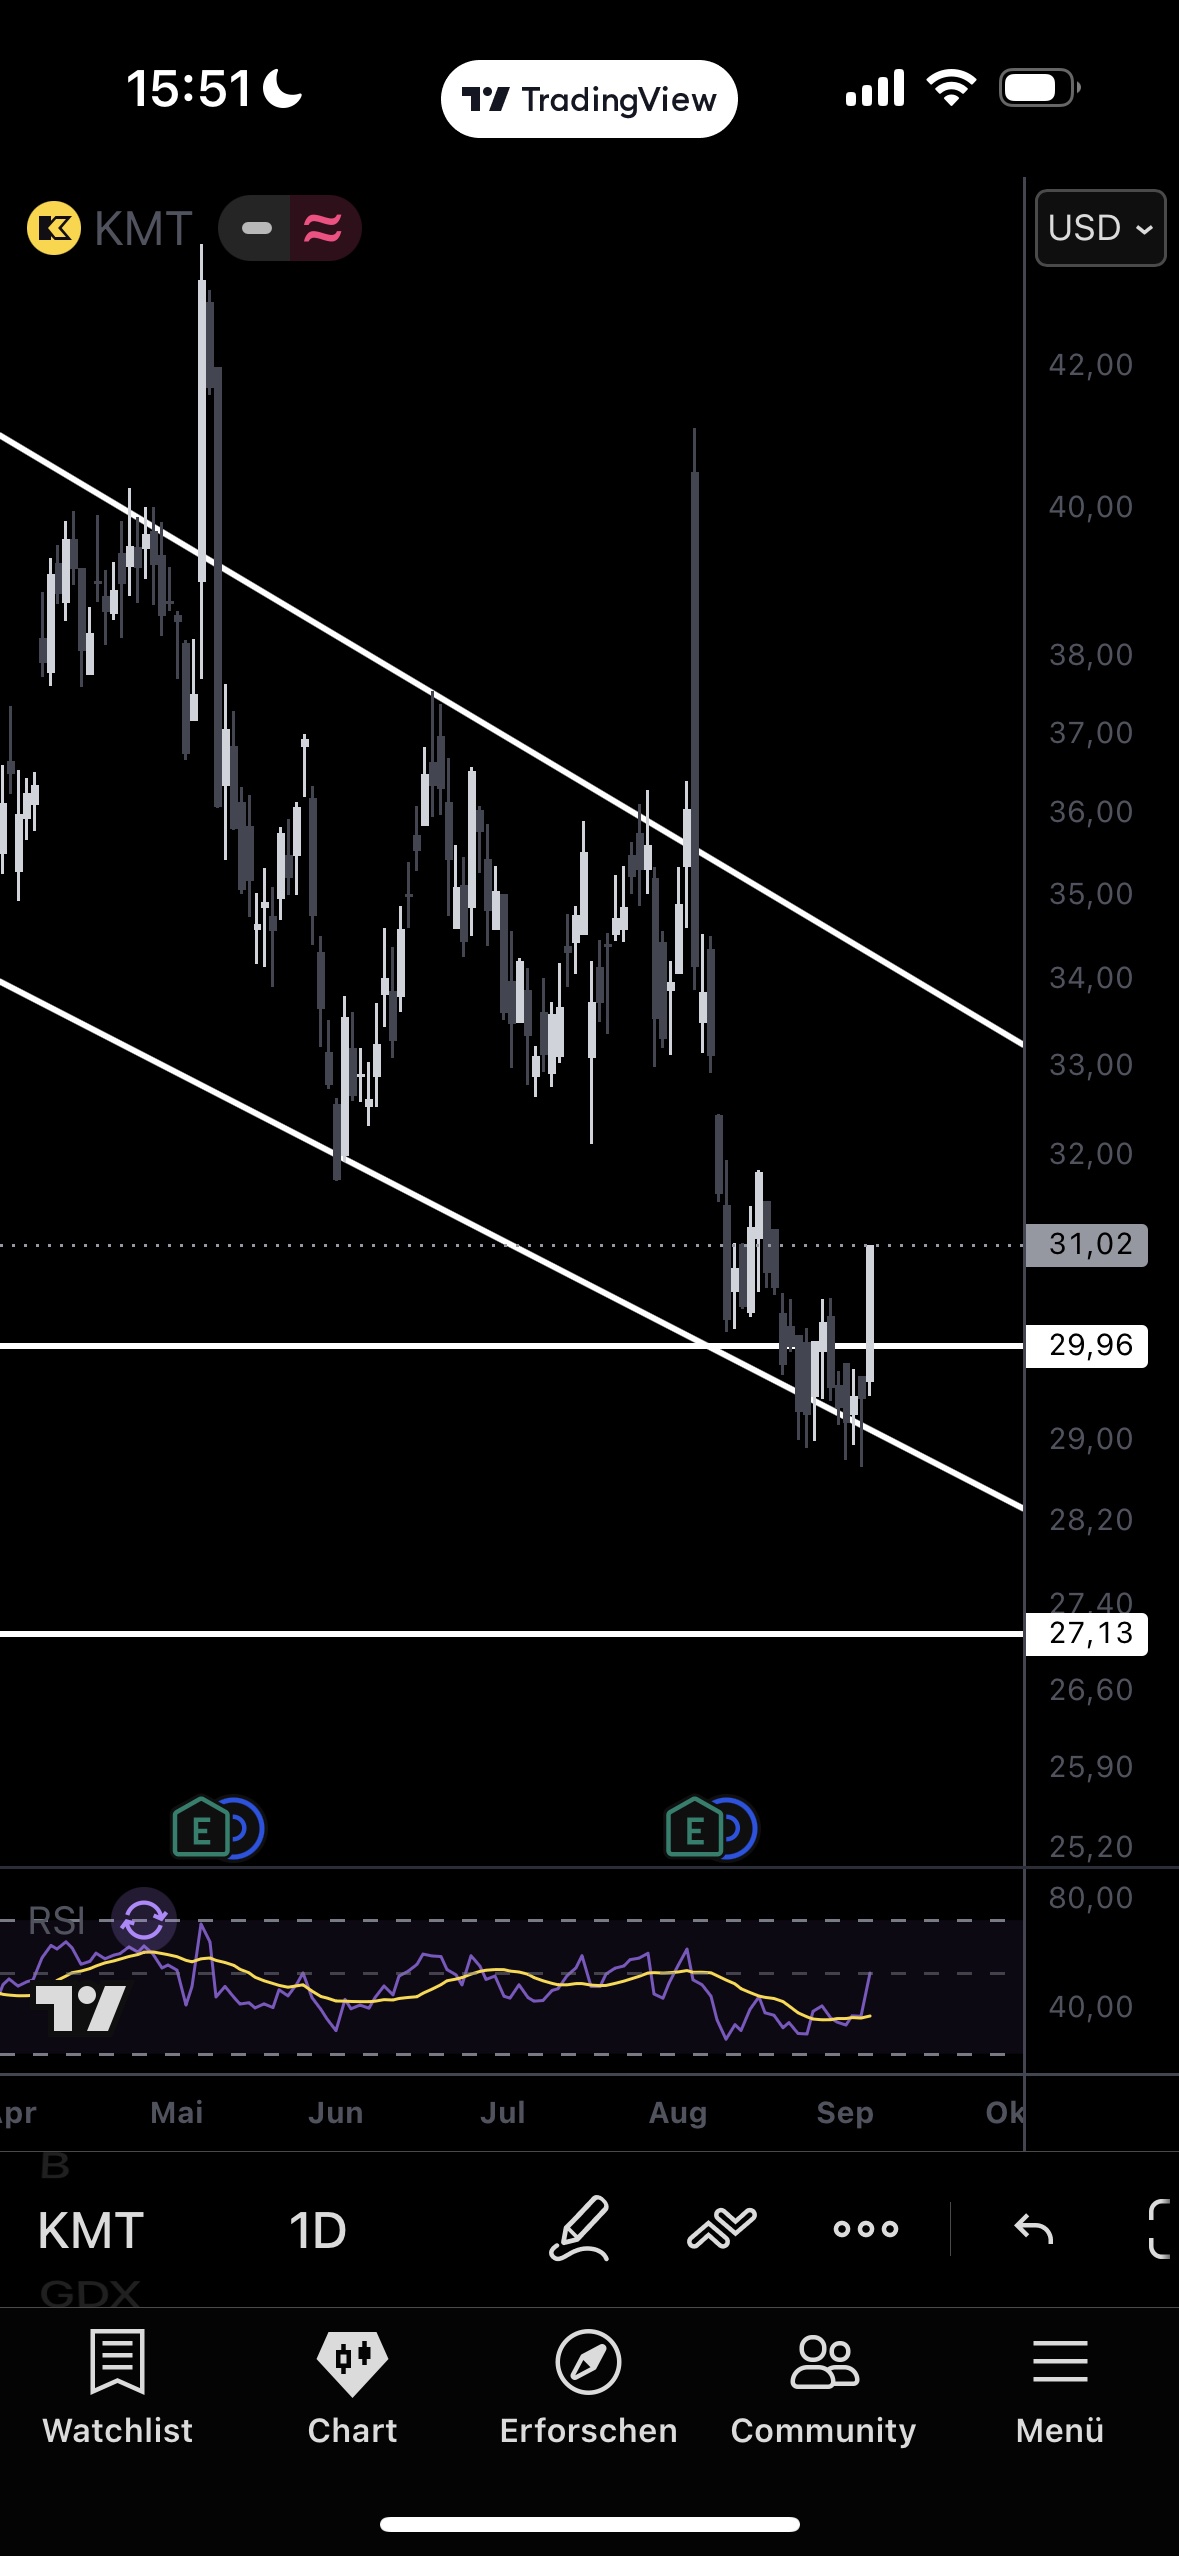
Third reversal attempt with clearly stronger follow-through: after the 28.93 reaction low, a breakout through 30.44 and 30.13 in sequence, day high 31.02 — real momentum for the first time instead of consolidation, RSI turning up out of oversold. A sustained close > 31.73 confirms the recovery structurally and opens 32.21–32.66; a drop < 28.93 fails the third attempt as well. The pullback from 31.02 to 29.96 is notable — only a consolidation above 30.13–30.44 confirms the breakout cleanly. JAN27 40C/50C unchanged, enough time.
Vale: first retest after the breakout.
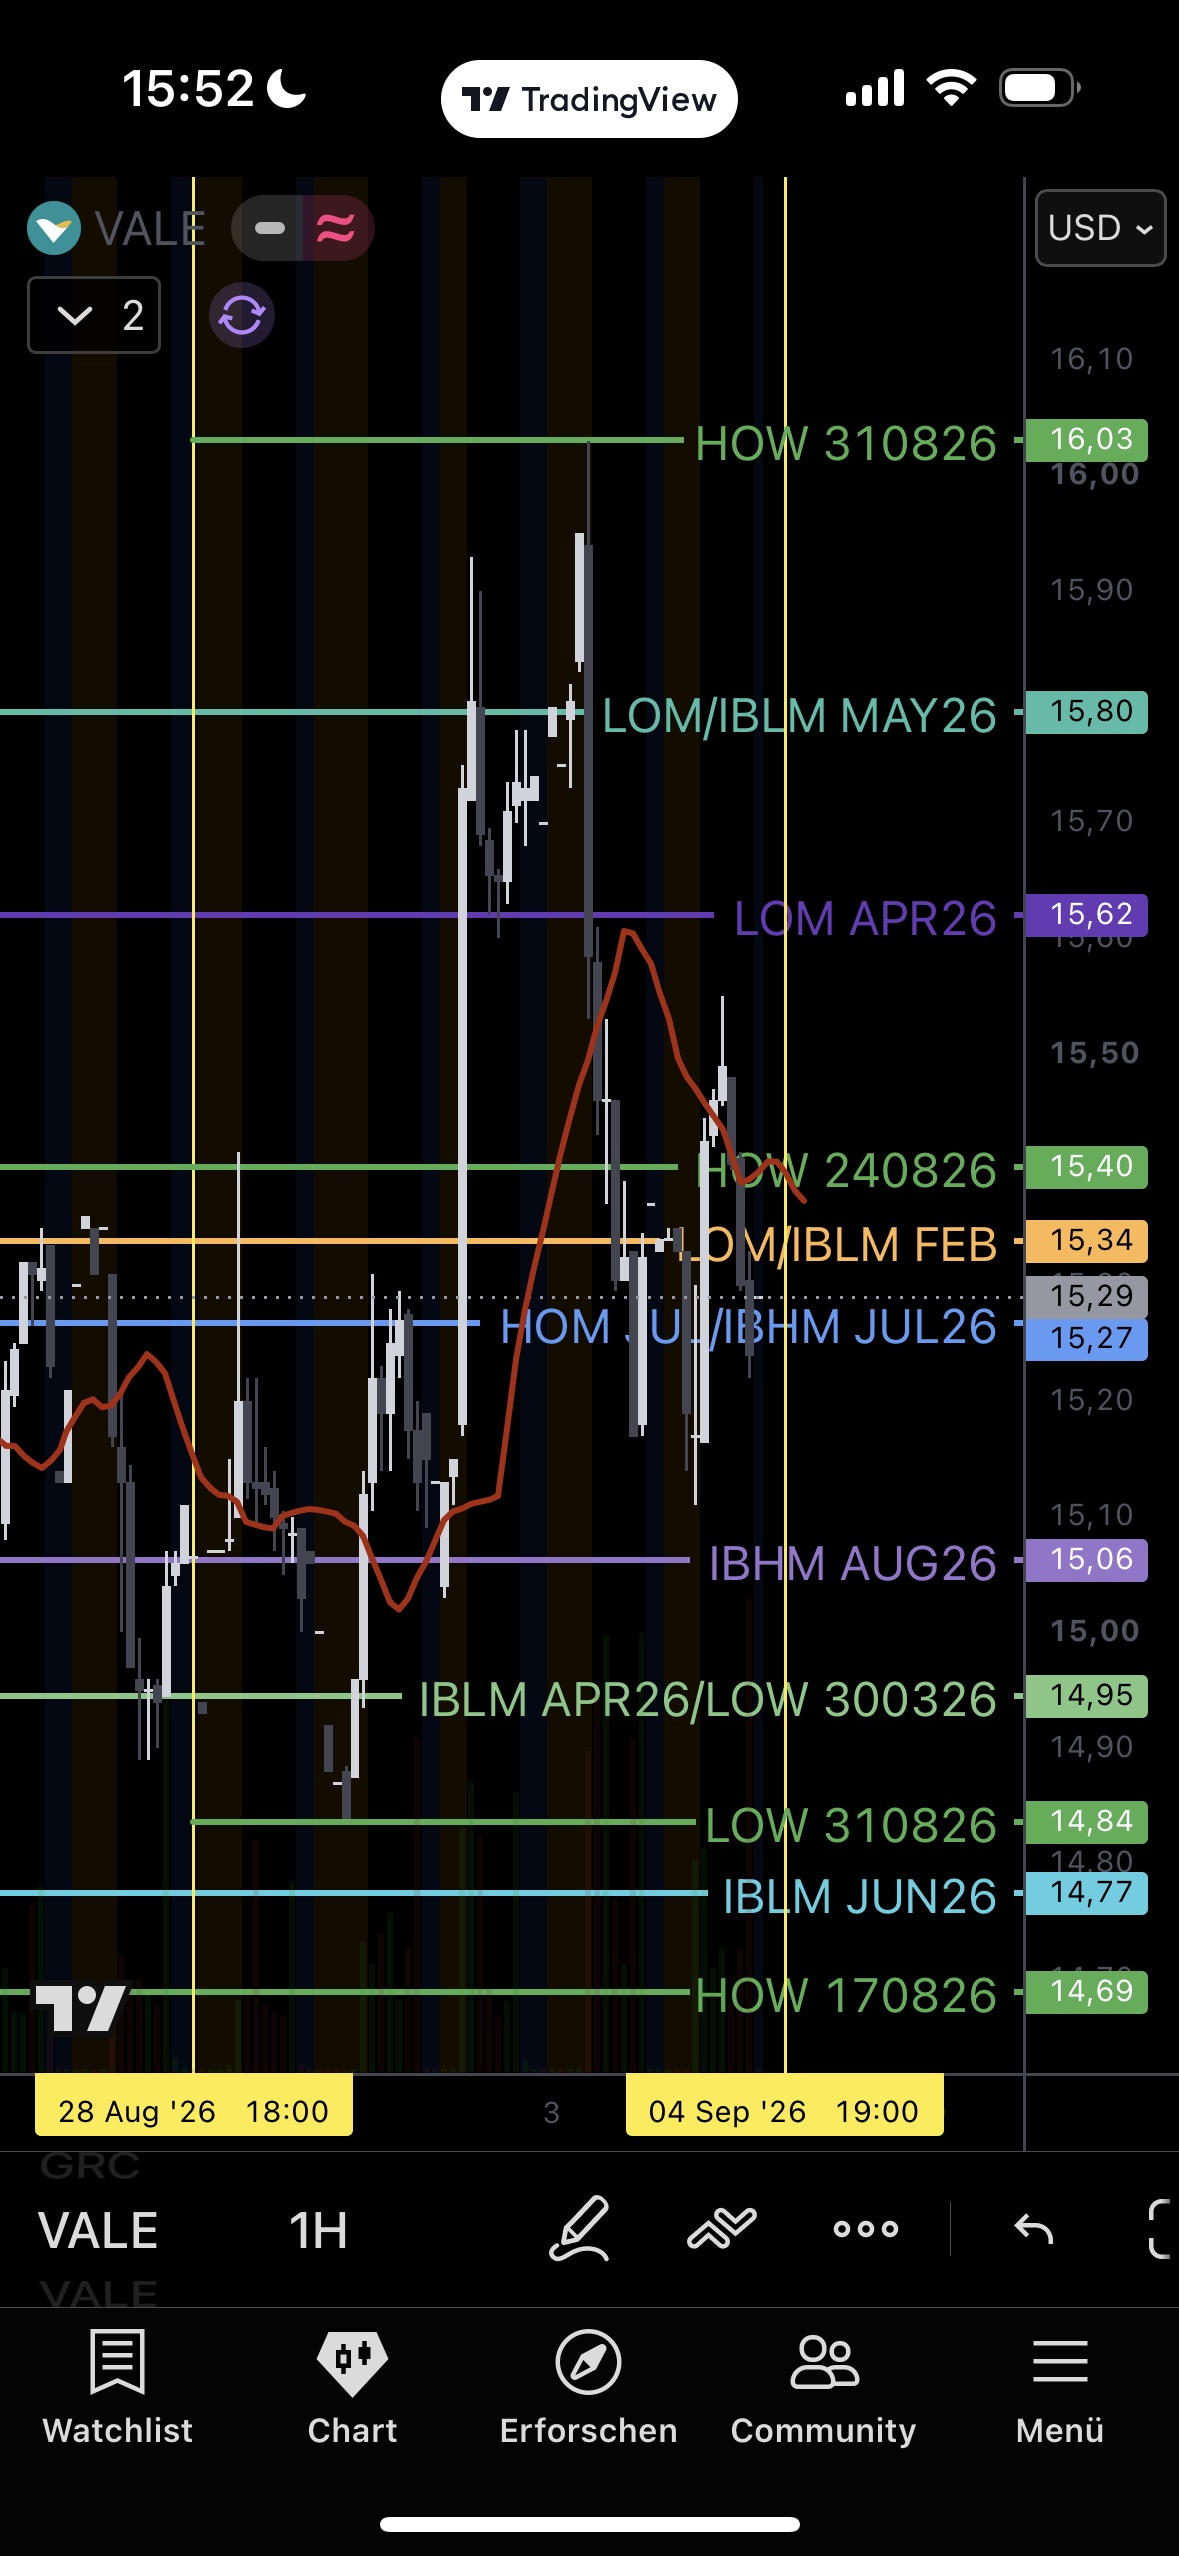
1D
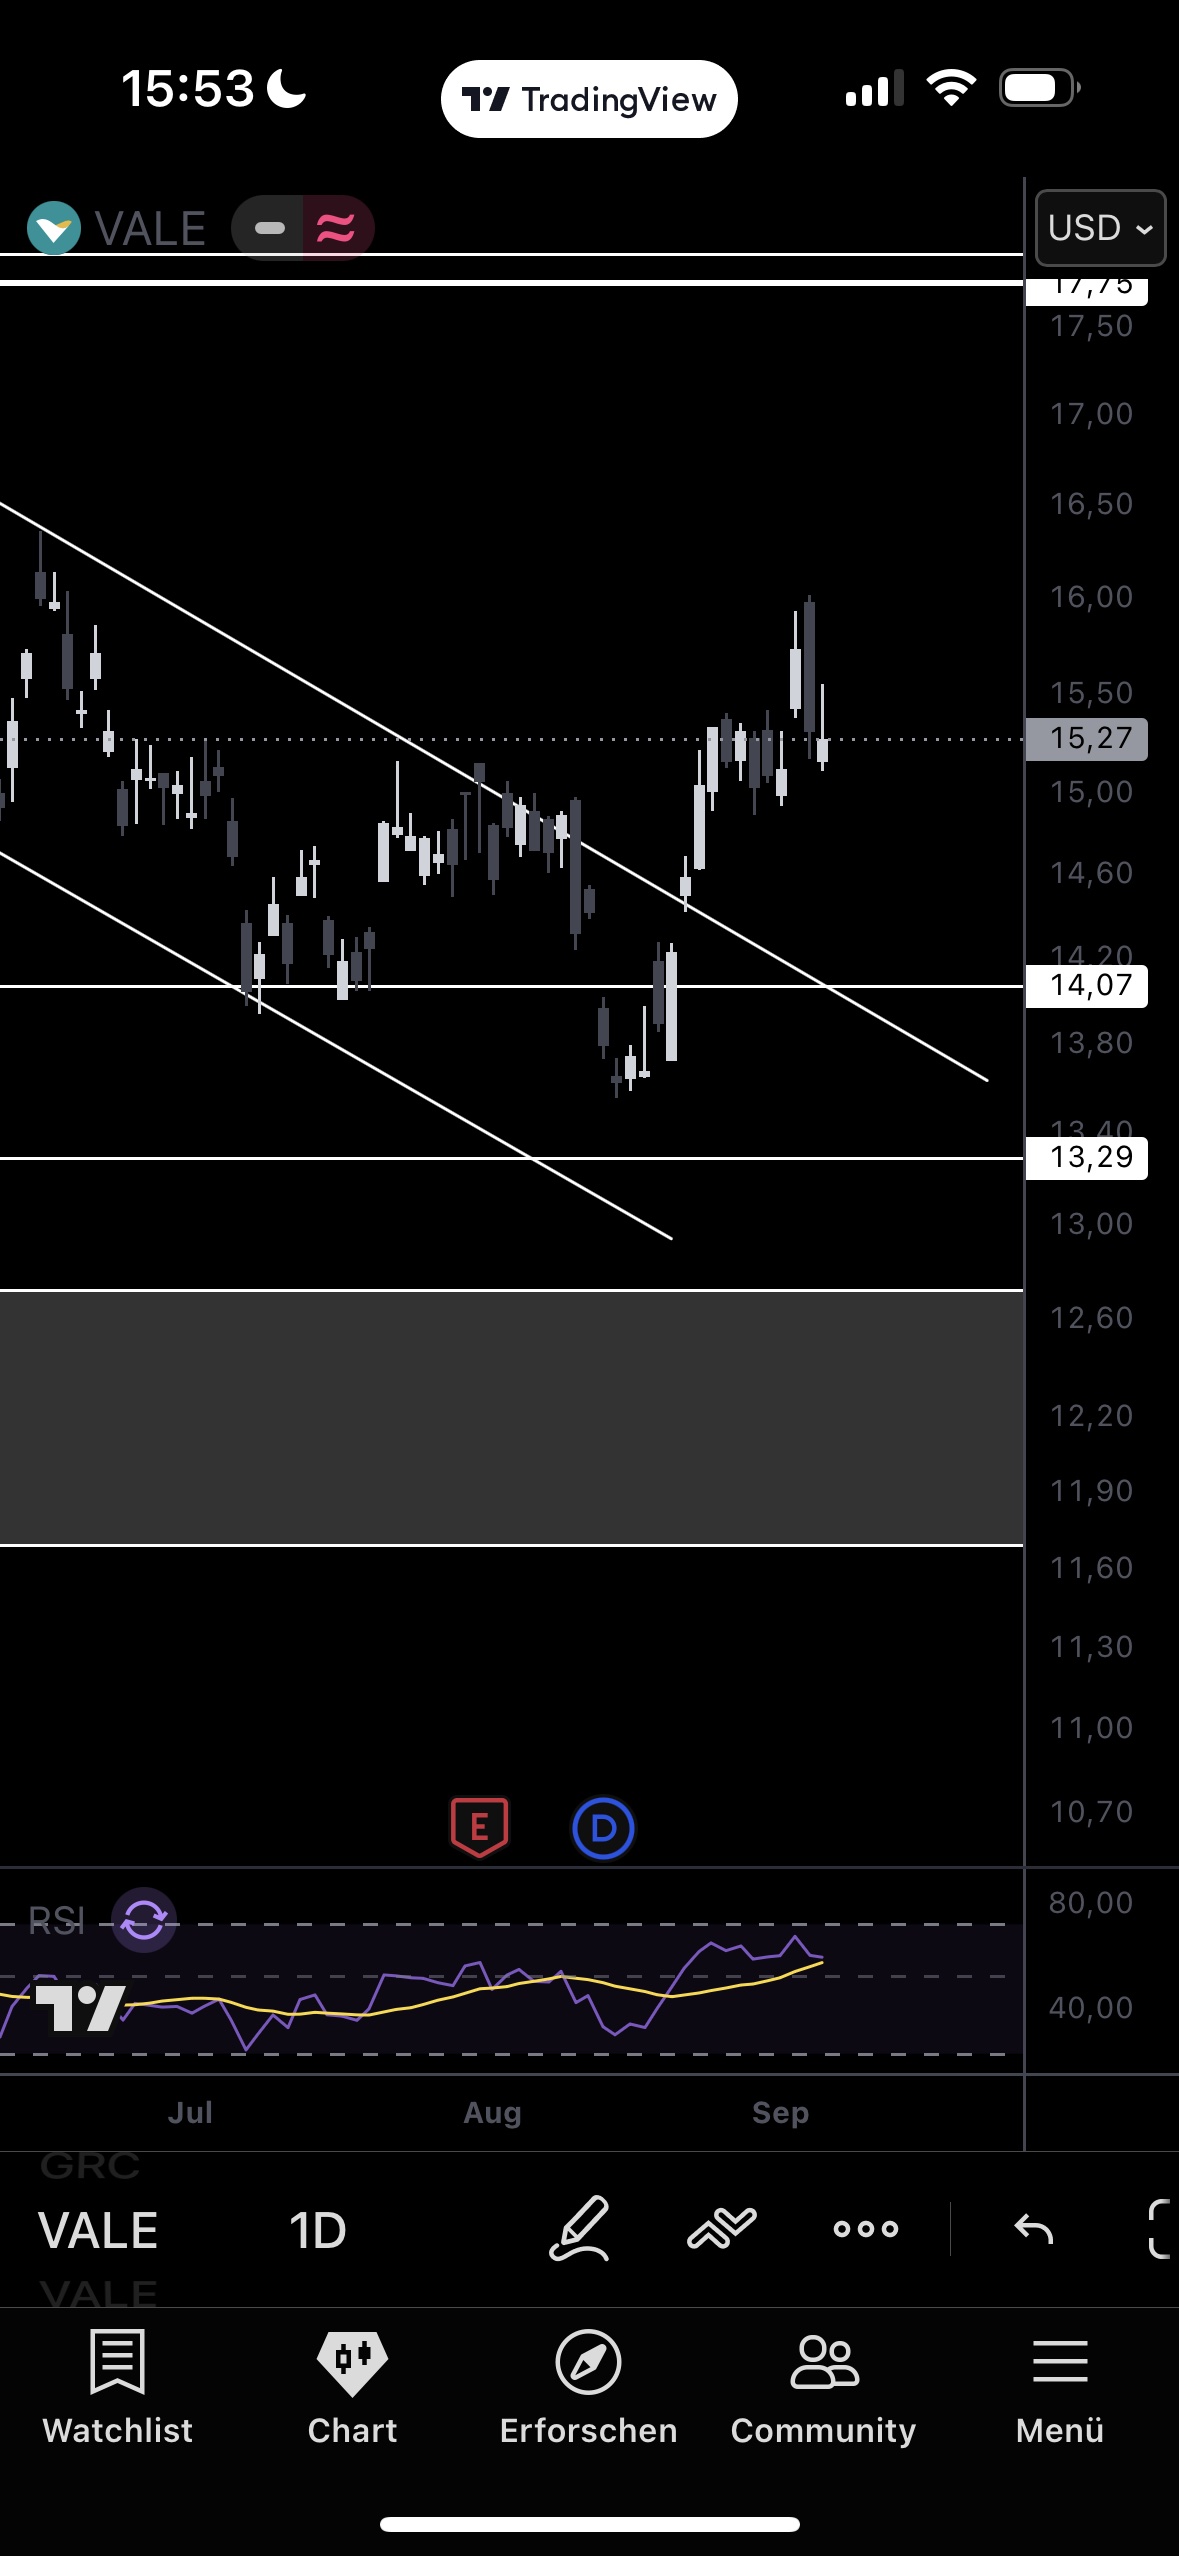
4H
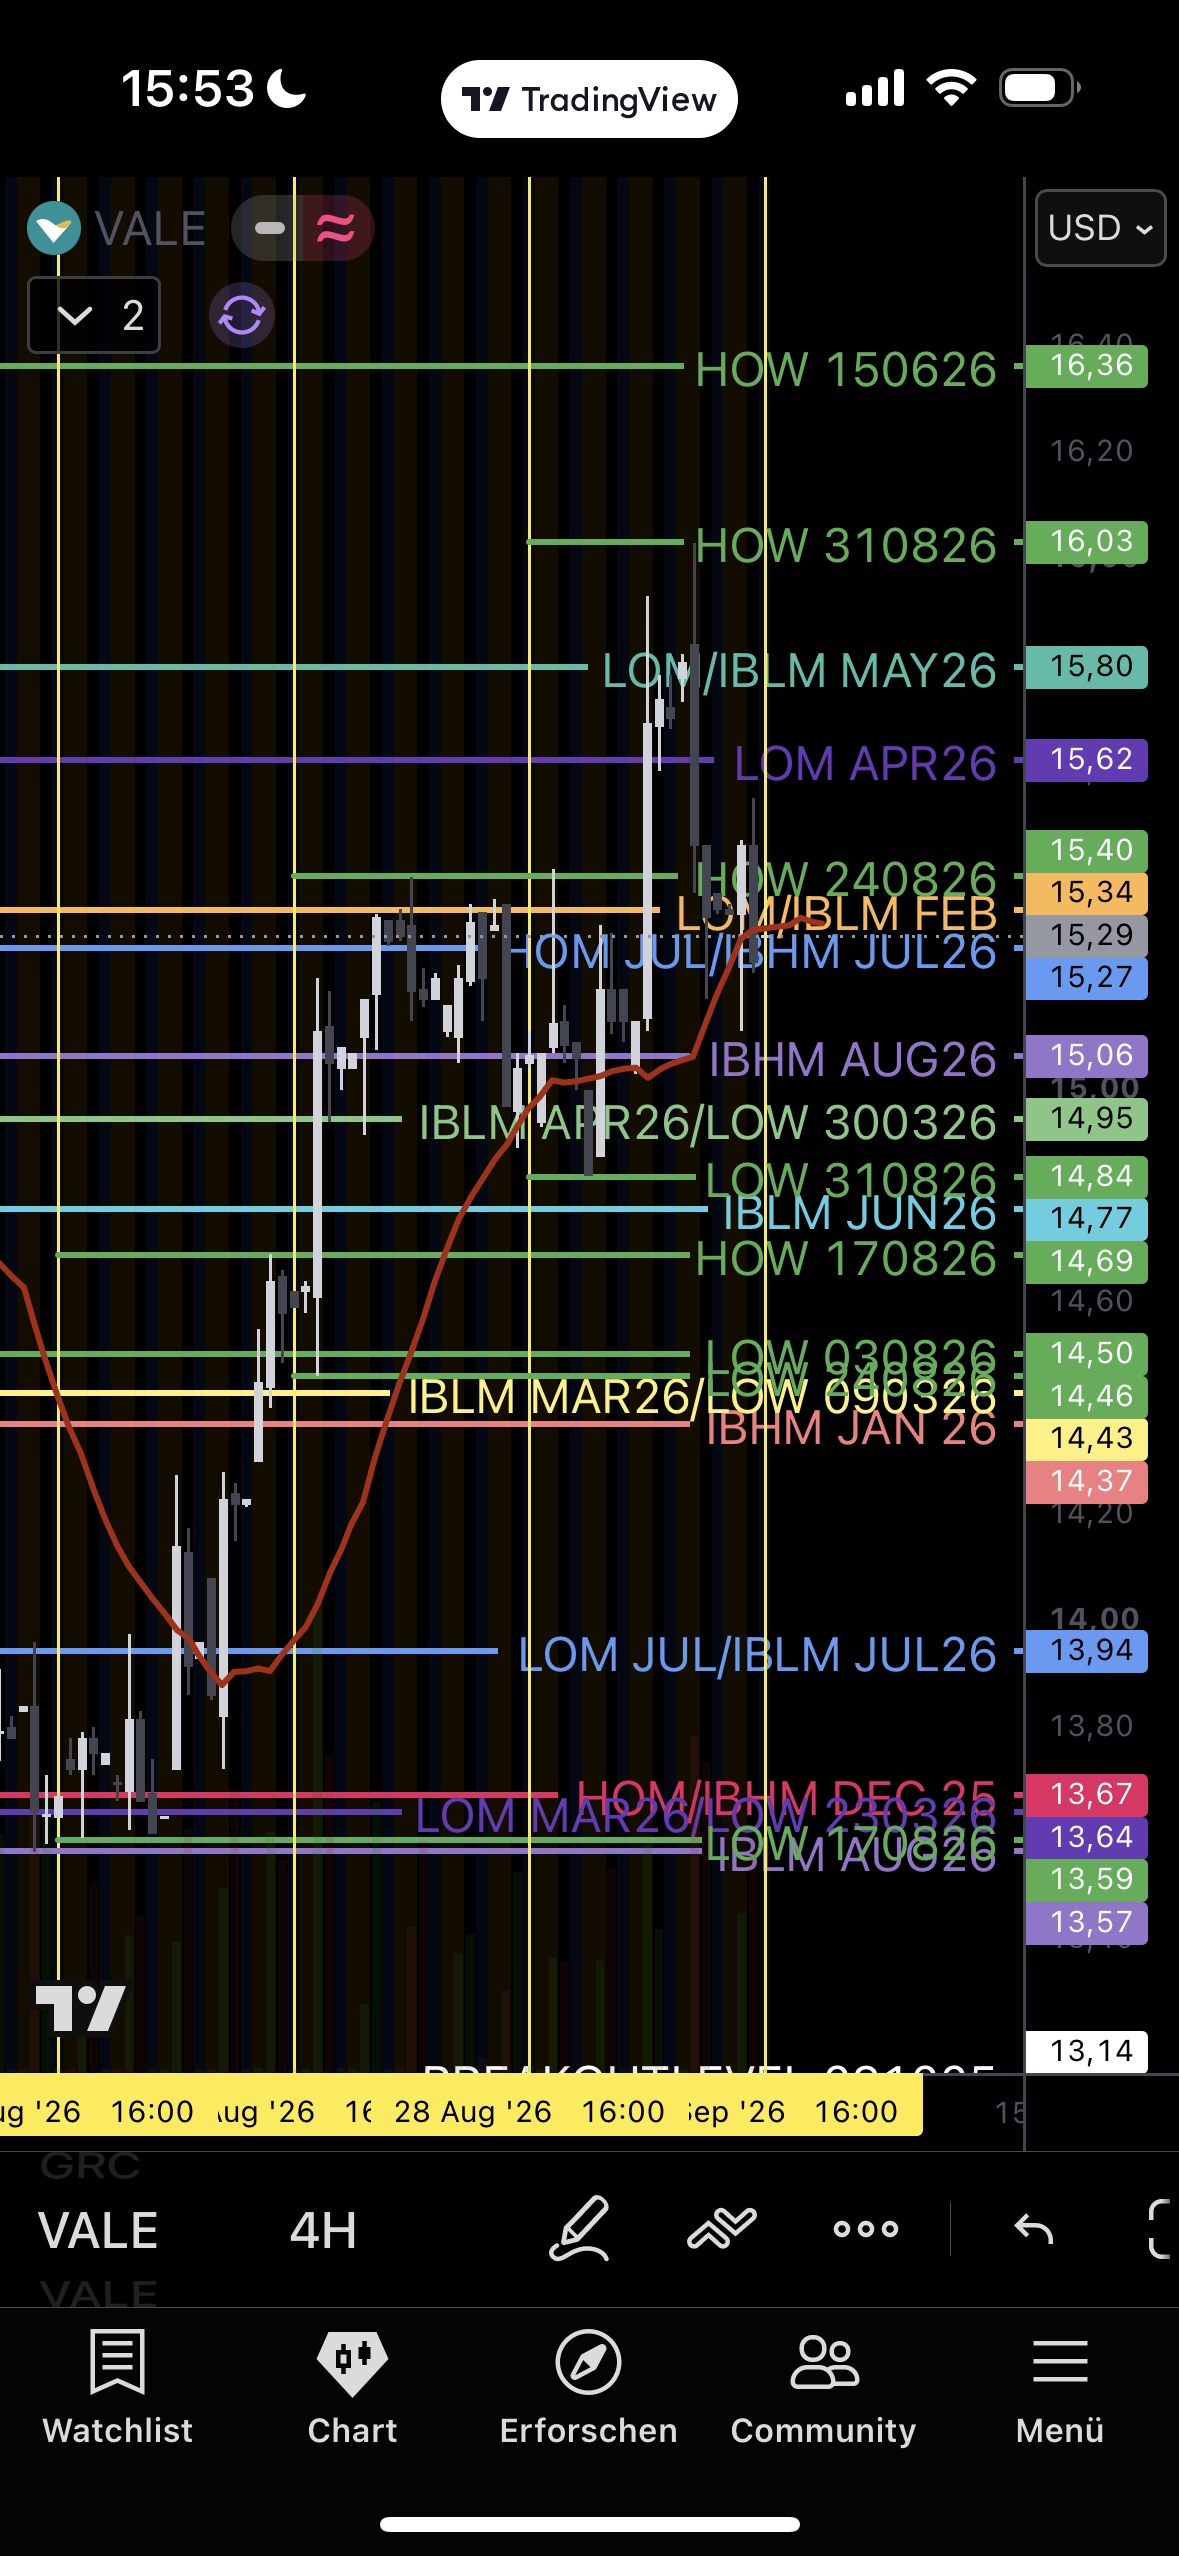
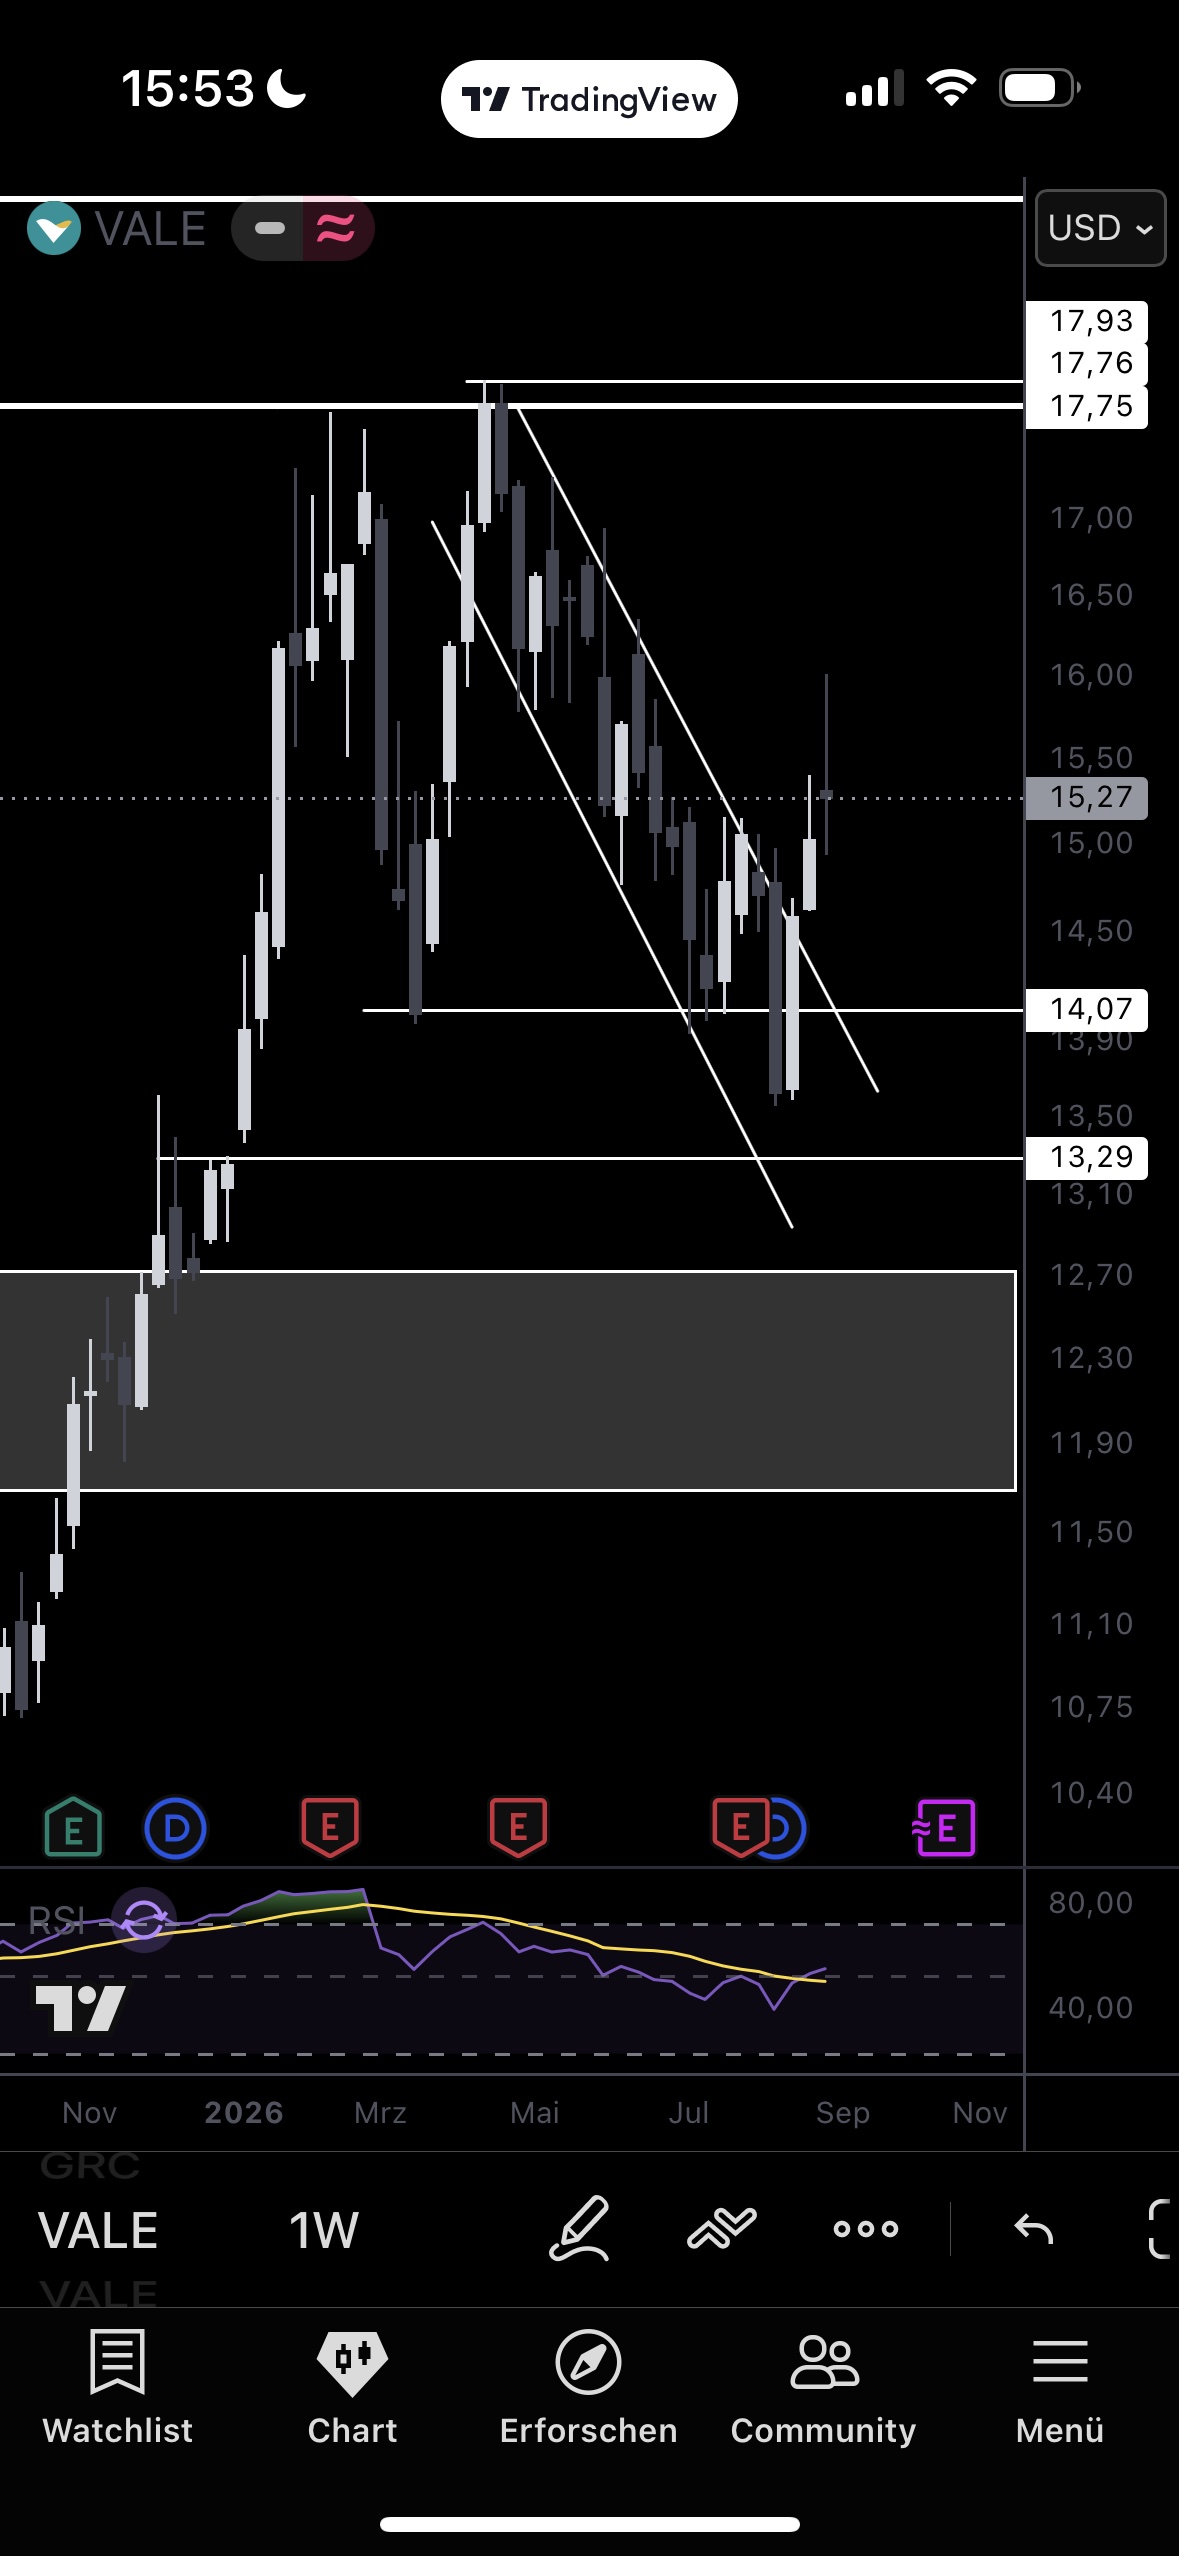
After the breakout day (+5.3% to 15.93) price ran to 16.03, was rejected, and has pulled back exactly onto the prior breakout zone — the expected retrace after the exhaustion candle, clean so far. Holding 15.06–15.27 followed by a reclaim of 16.03 confirms the breakout and opens 17.08–17.75; a drop < 14.95 disqualifies the breakout day. Options relevance corrected: 10 contracts (DEC26 16/17/18C, JAN27 17/18C, 2L each), all OTM. In the exit plan: clean up to 1 contract.
Freeport-McMoRan: exit trigger hit.
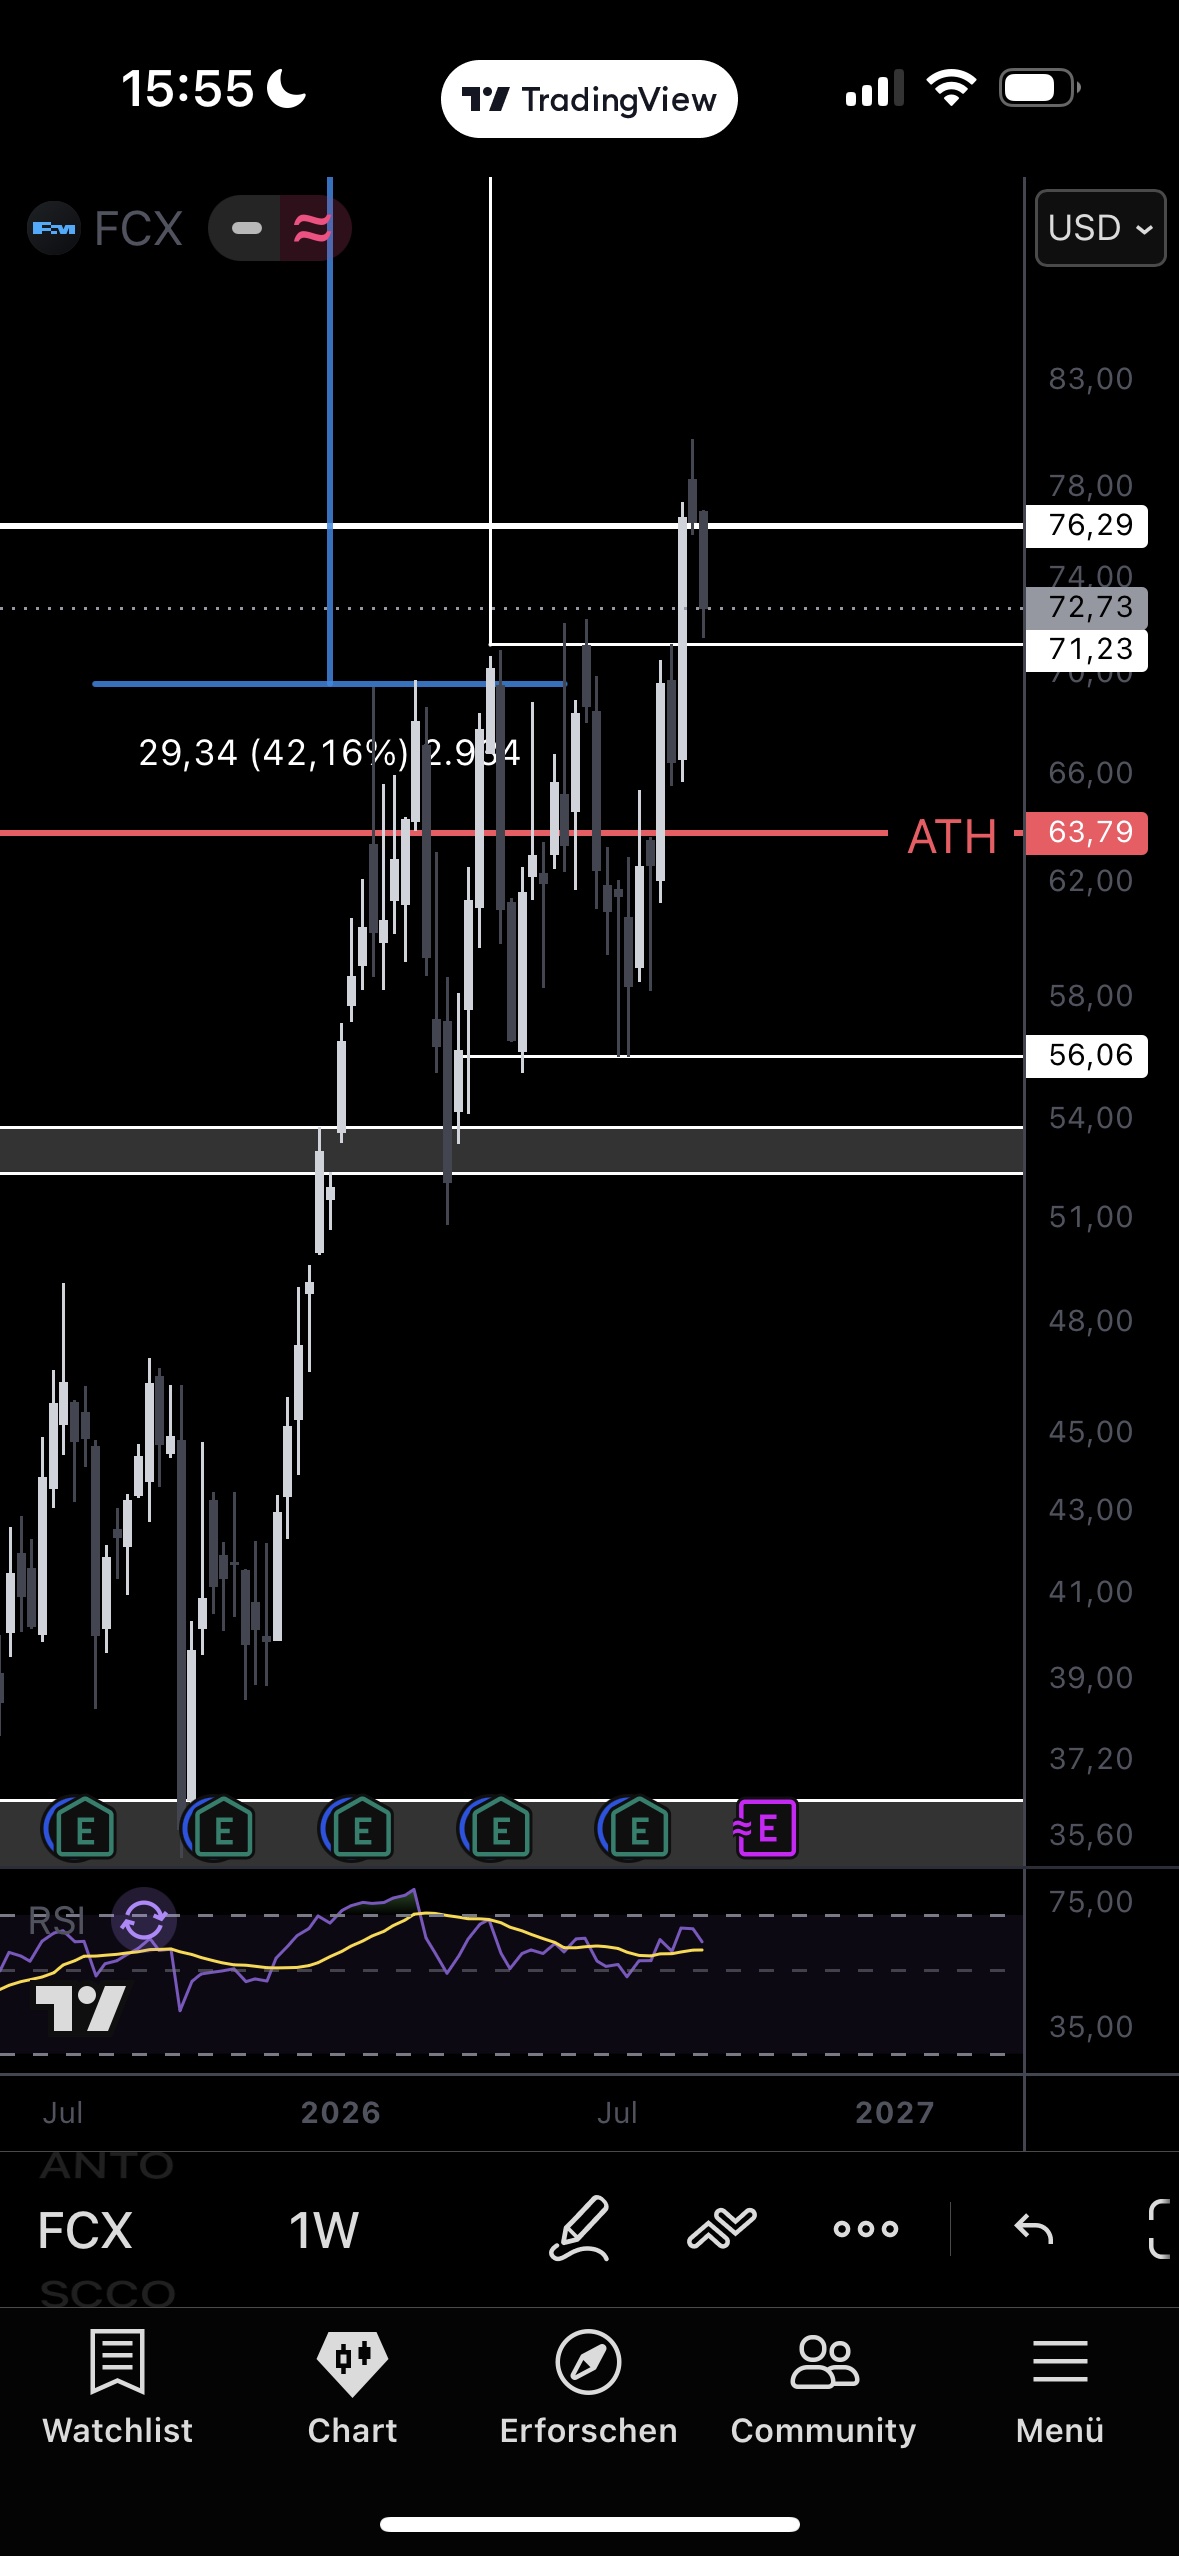
1D
4H
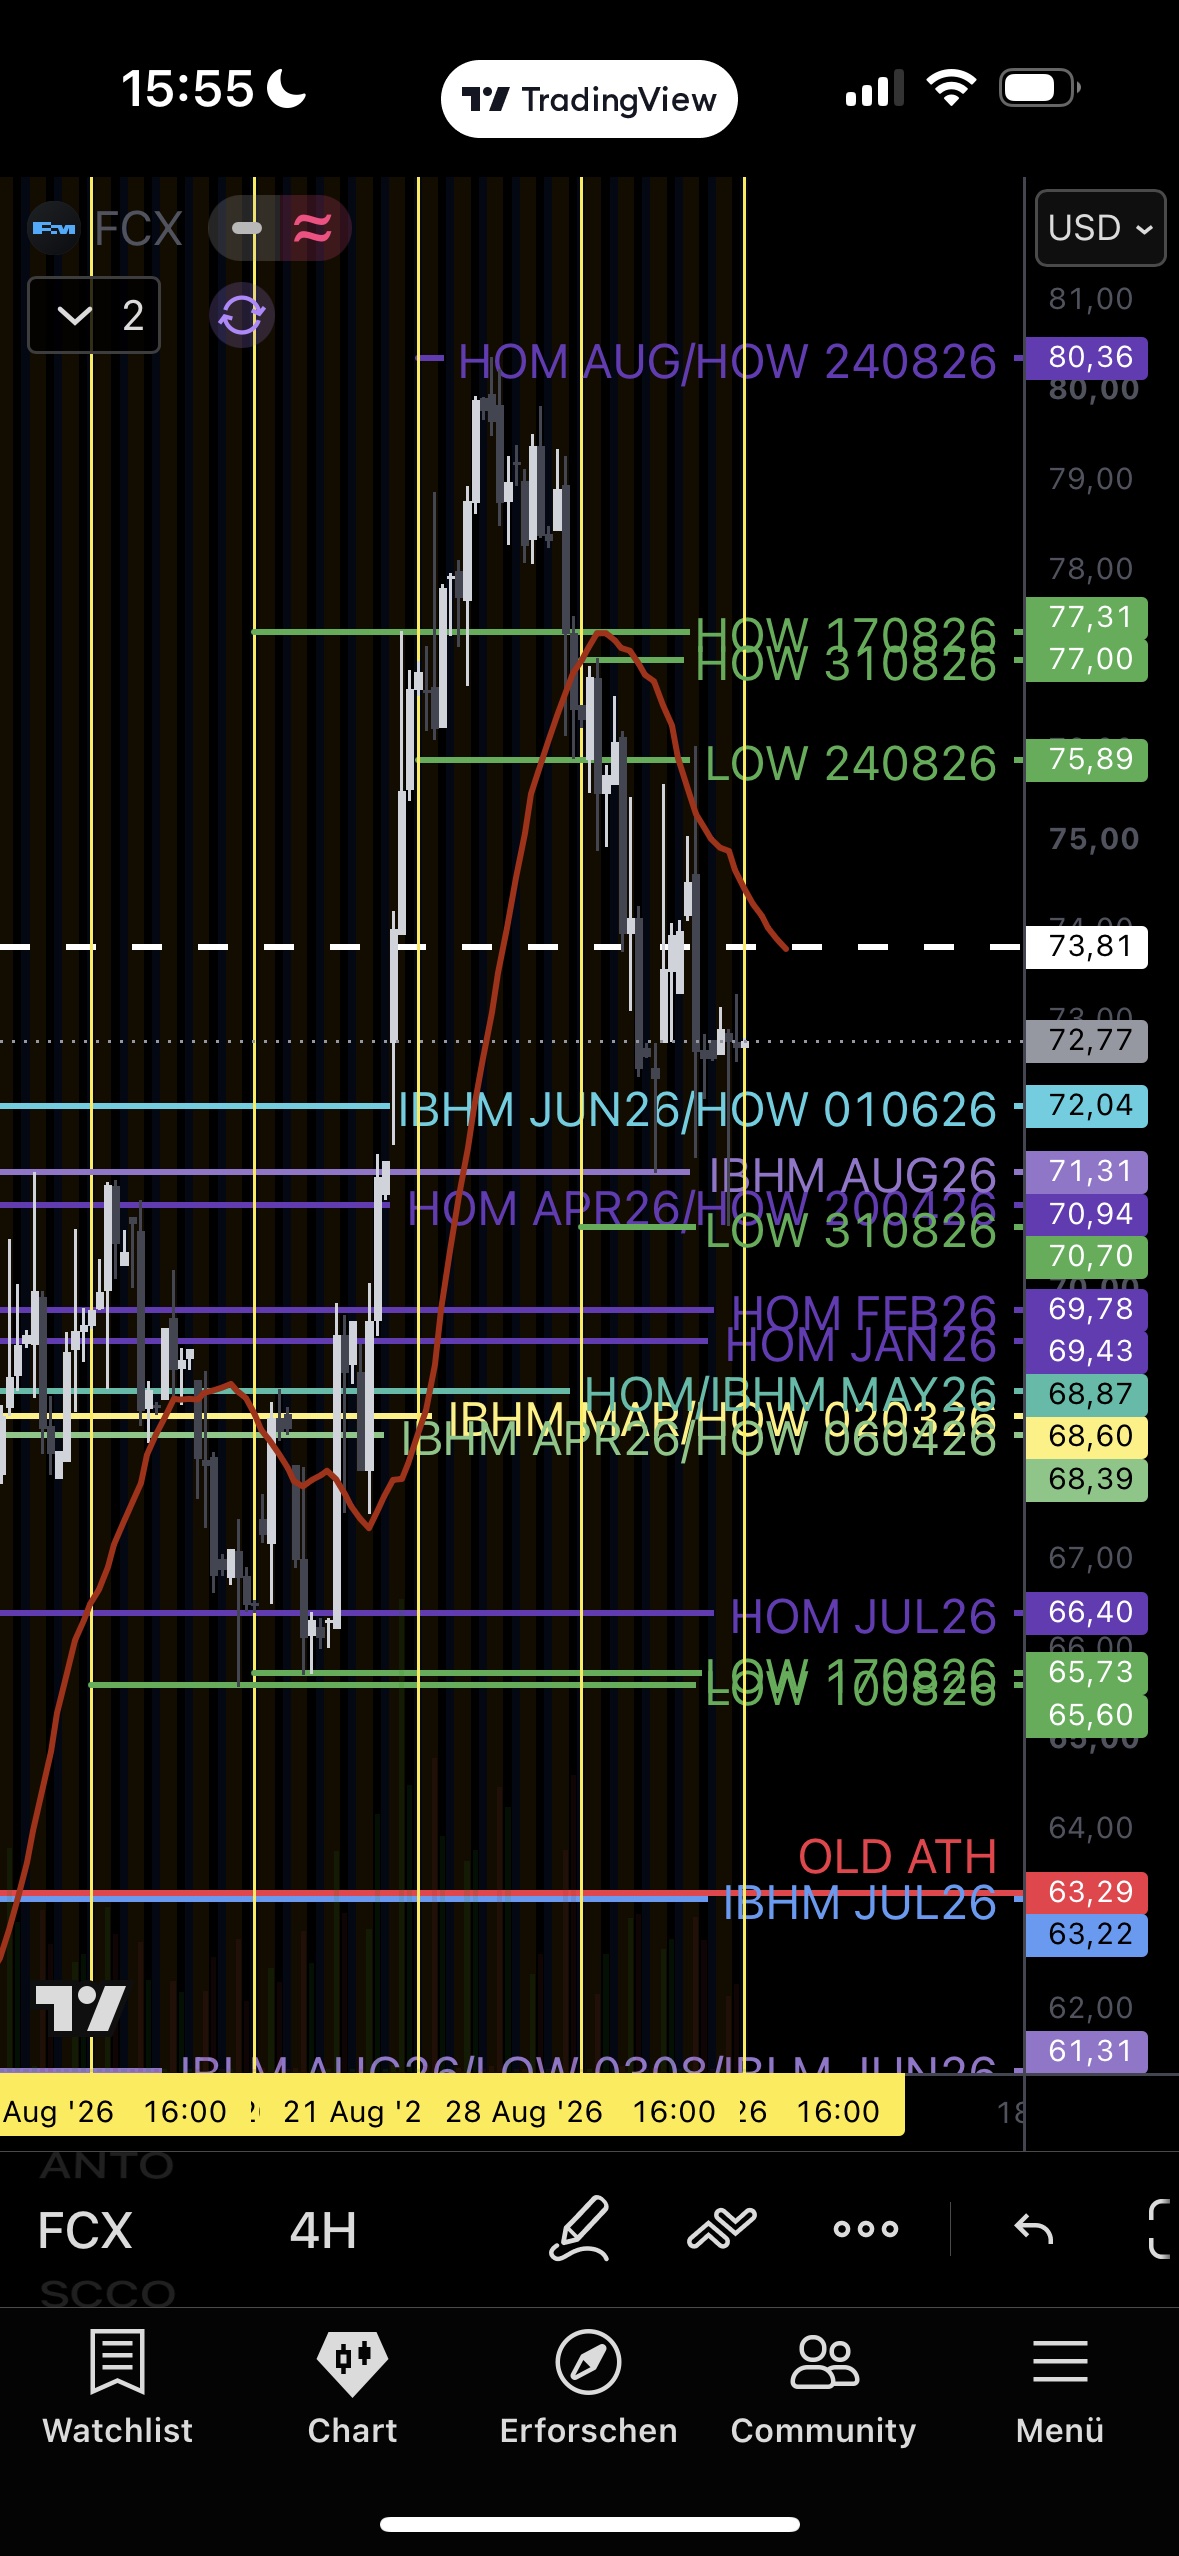
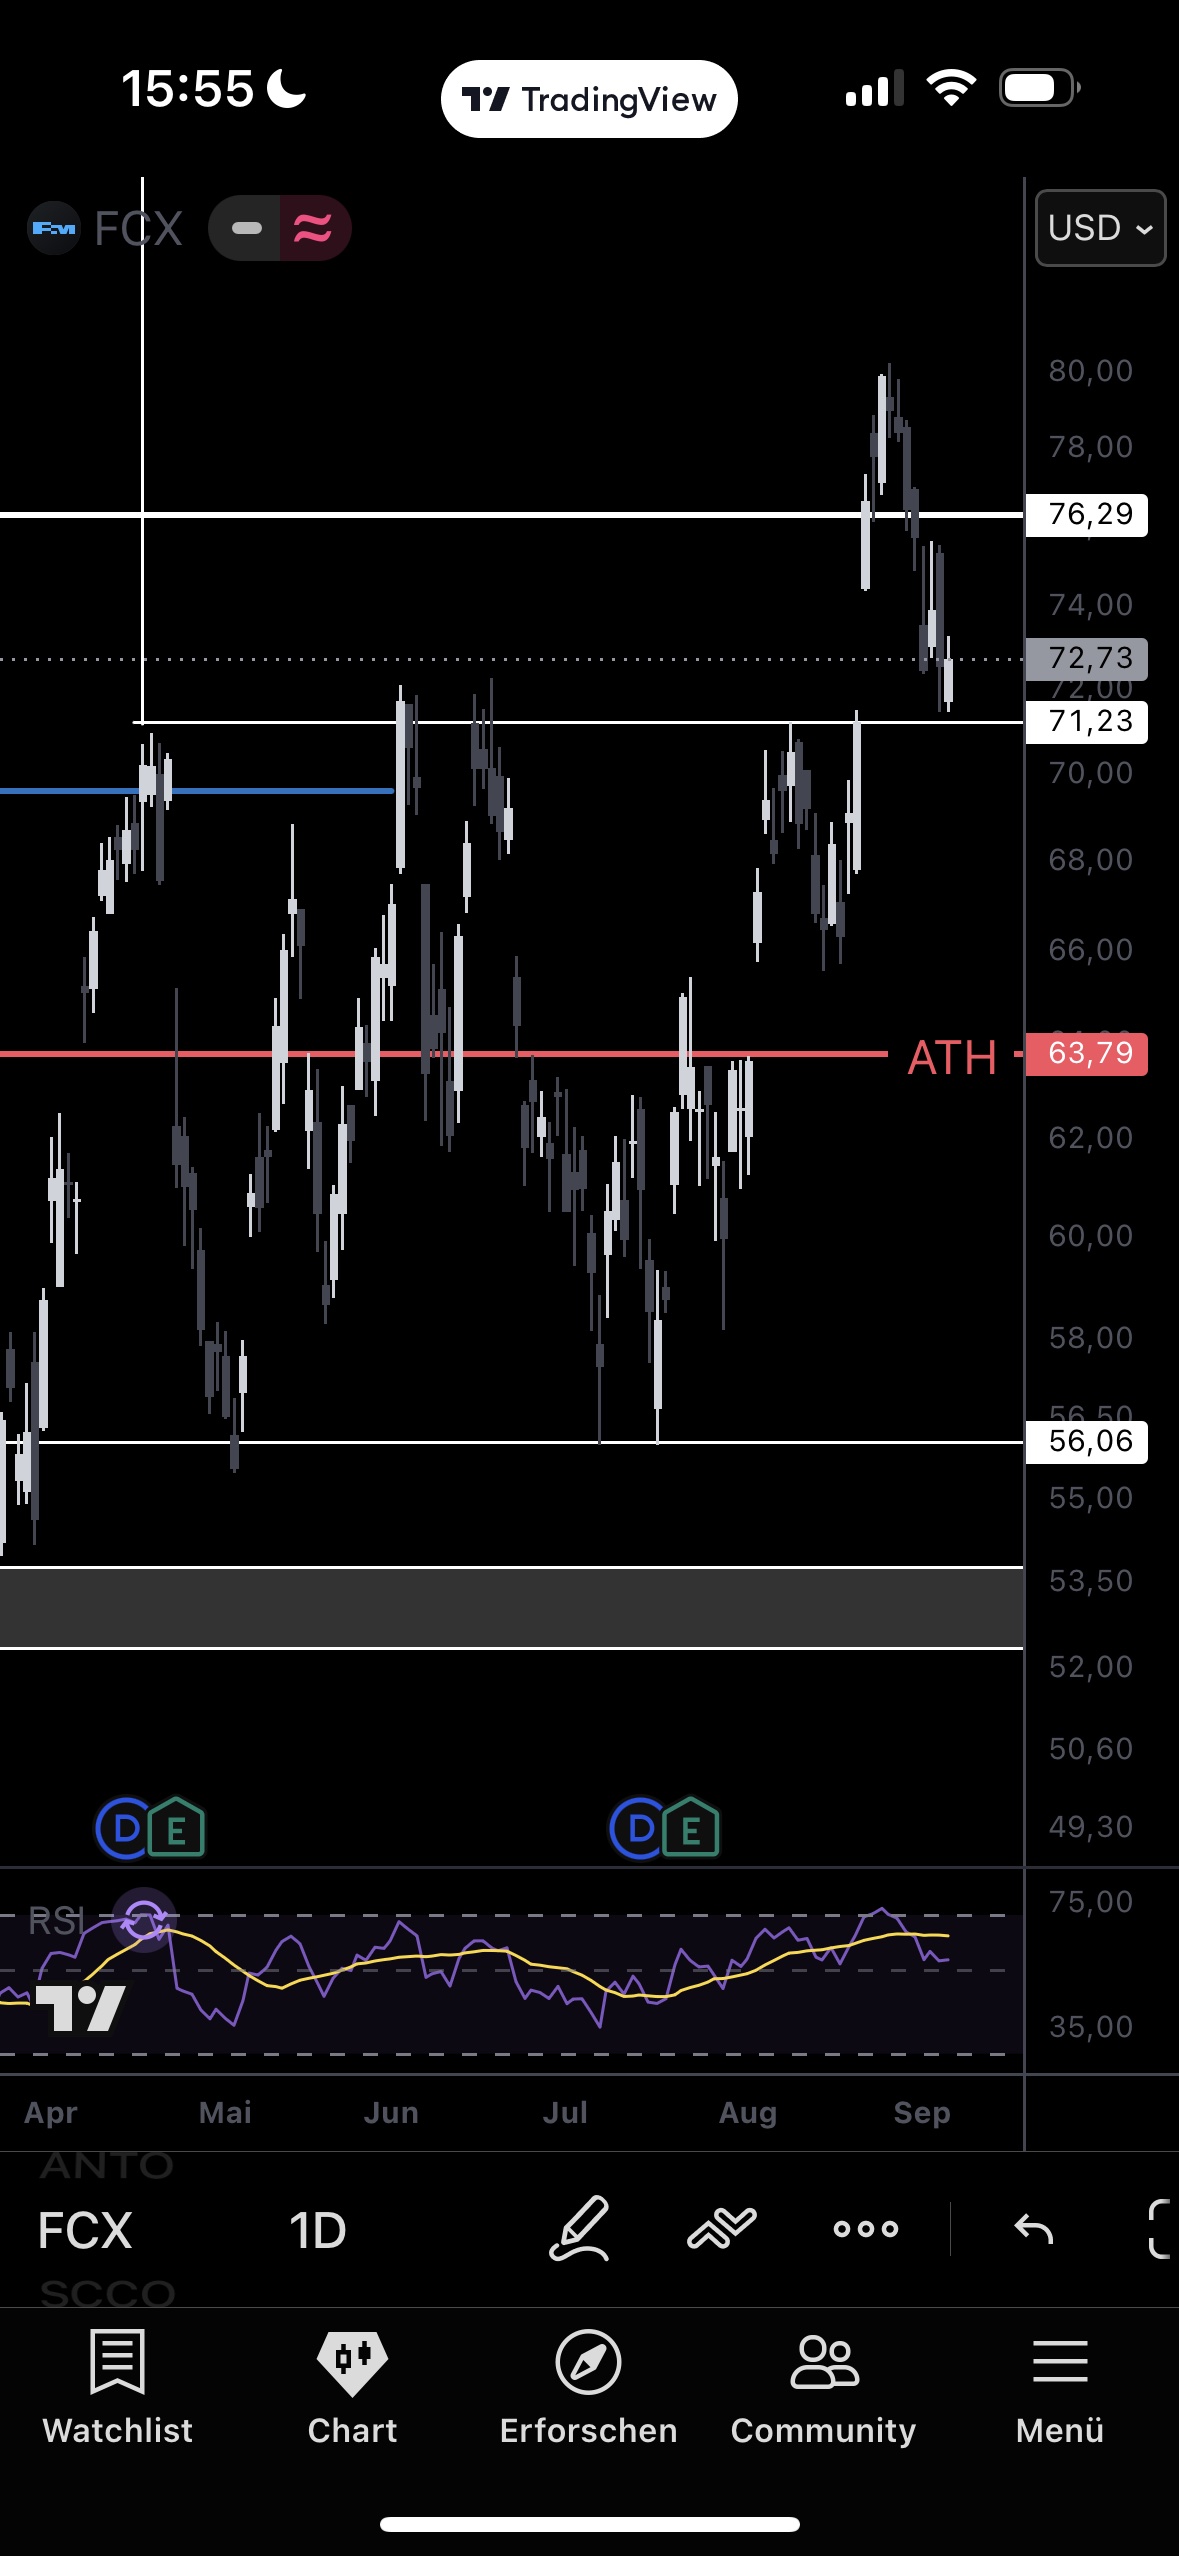
After the 80.36 52-week high, a −9.6% correction: both support levels (75.89, 73.81) were traded straight through, no bounce. Price sits right on the critical 70.70–72.04 cluster (IBHM JUN26, IBHM AUG26, HOM APR26, LOW310826) — it has to hold. Pullback volume is below average (7.3M vs. avg 14.6M) — argues against panic or a new negative story, more like profit-taking after +20% in two weeks; copper only touched 6.7150/6.8650 on a spike, no confirmation. Bull case: hold the cluster plus reclaim 75.89. Structural invalidation: daily close < 70.70.
Consequence: FCX is the first ticker where the exit plan's position exit trigger has been hit. The FCX NOV26 special case (75C 6L, breakeven 82.54 · 80C 4L, breakeven 86.36 · expiry Nov 20, 11 weeks) was already scheduled for FOMC Sep 16 at the latest — the decision is brought forward to this week, ahead of PPI/CPI. The "healthier value test" argument does not apply to the NOV calls; the clock is running there. The JUN27 75C is not affected.
What changed in one week.
1. The NFP beat flips the "growth scare" read and Leg 3 — not the metals thesis: the dollar stays weak, the old yield/dollar correlation no longer holds. The macro foundation now rests primarily on Leg 5 and exactly that DXY divergence. 2. Gold: continuation level broken, cluster tested, back above 4,400 — no trigger, blow-off path closed for now. 3. Copper: first blow-off touch in the complex, sold straight away. 4. FCX: trigger hit, NOV decision brought forward. 5. All other tickers: consolidation without a trigger, HL thesis corrected.
Open: FCX NOV 75C/80C — decision this week · add XAUUSD cycles 3 and 4, re-entry ladder below the lowest weekly low (4,283) · read the copper spike high precisely (≈7.0–7.05) · check TIPS real yields/breakevens · mark concrete target levels above the highs for NEM/FCX/FRES on the charts.
Exit plan roadmap: close the September IB first (Fri Sep 11), then watch the balance. The trim trigger remains the October monthly IBH near/above the September high. Risk reduction is set — the question is how and when on a level basis, not whether.
August 2026
WEEK 13▸
The pump first, then the breath.
The week splits into two halves: through Monday/Tuesday the sector kept pushing higher — several positions (NEM, WPM, FCX) printed new multi-week or 52-week highs. Then came the pullback, broad-based across the board: NEM, AEM, WPM, FCX, Gold.com all gave back part of the advance. After the extreme pump the mining sector has put in over recent weeks, that's not a surprise — it's the normal exhale. No setup lost its structure in the process; the lows across the board are printing higher than the week before.
The week was overlaid by the Jackson Hole / Warsh keynote (Aug 28): a broad yield spike across the whole curve hit the predefined invalidation zone of Leg 3 (US 10Y) without breaking it. So far "talk, not action" — the next hard data point is the NFP report on Sep 4.
Robust trends, healthy pullbacks.
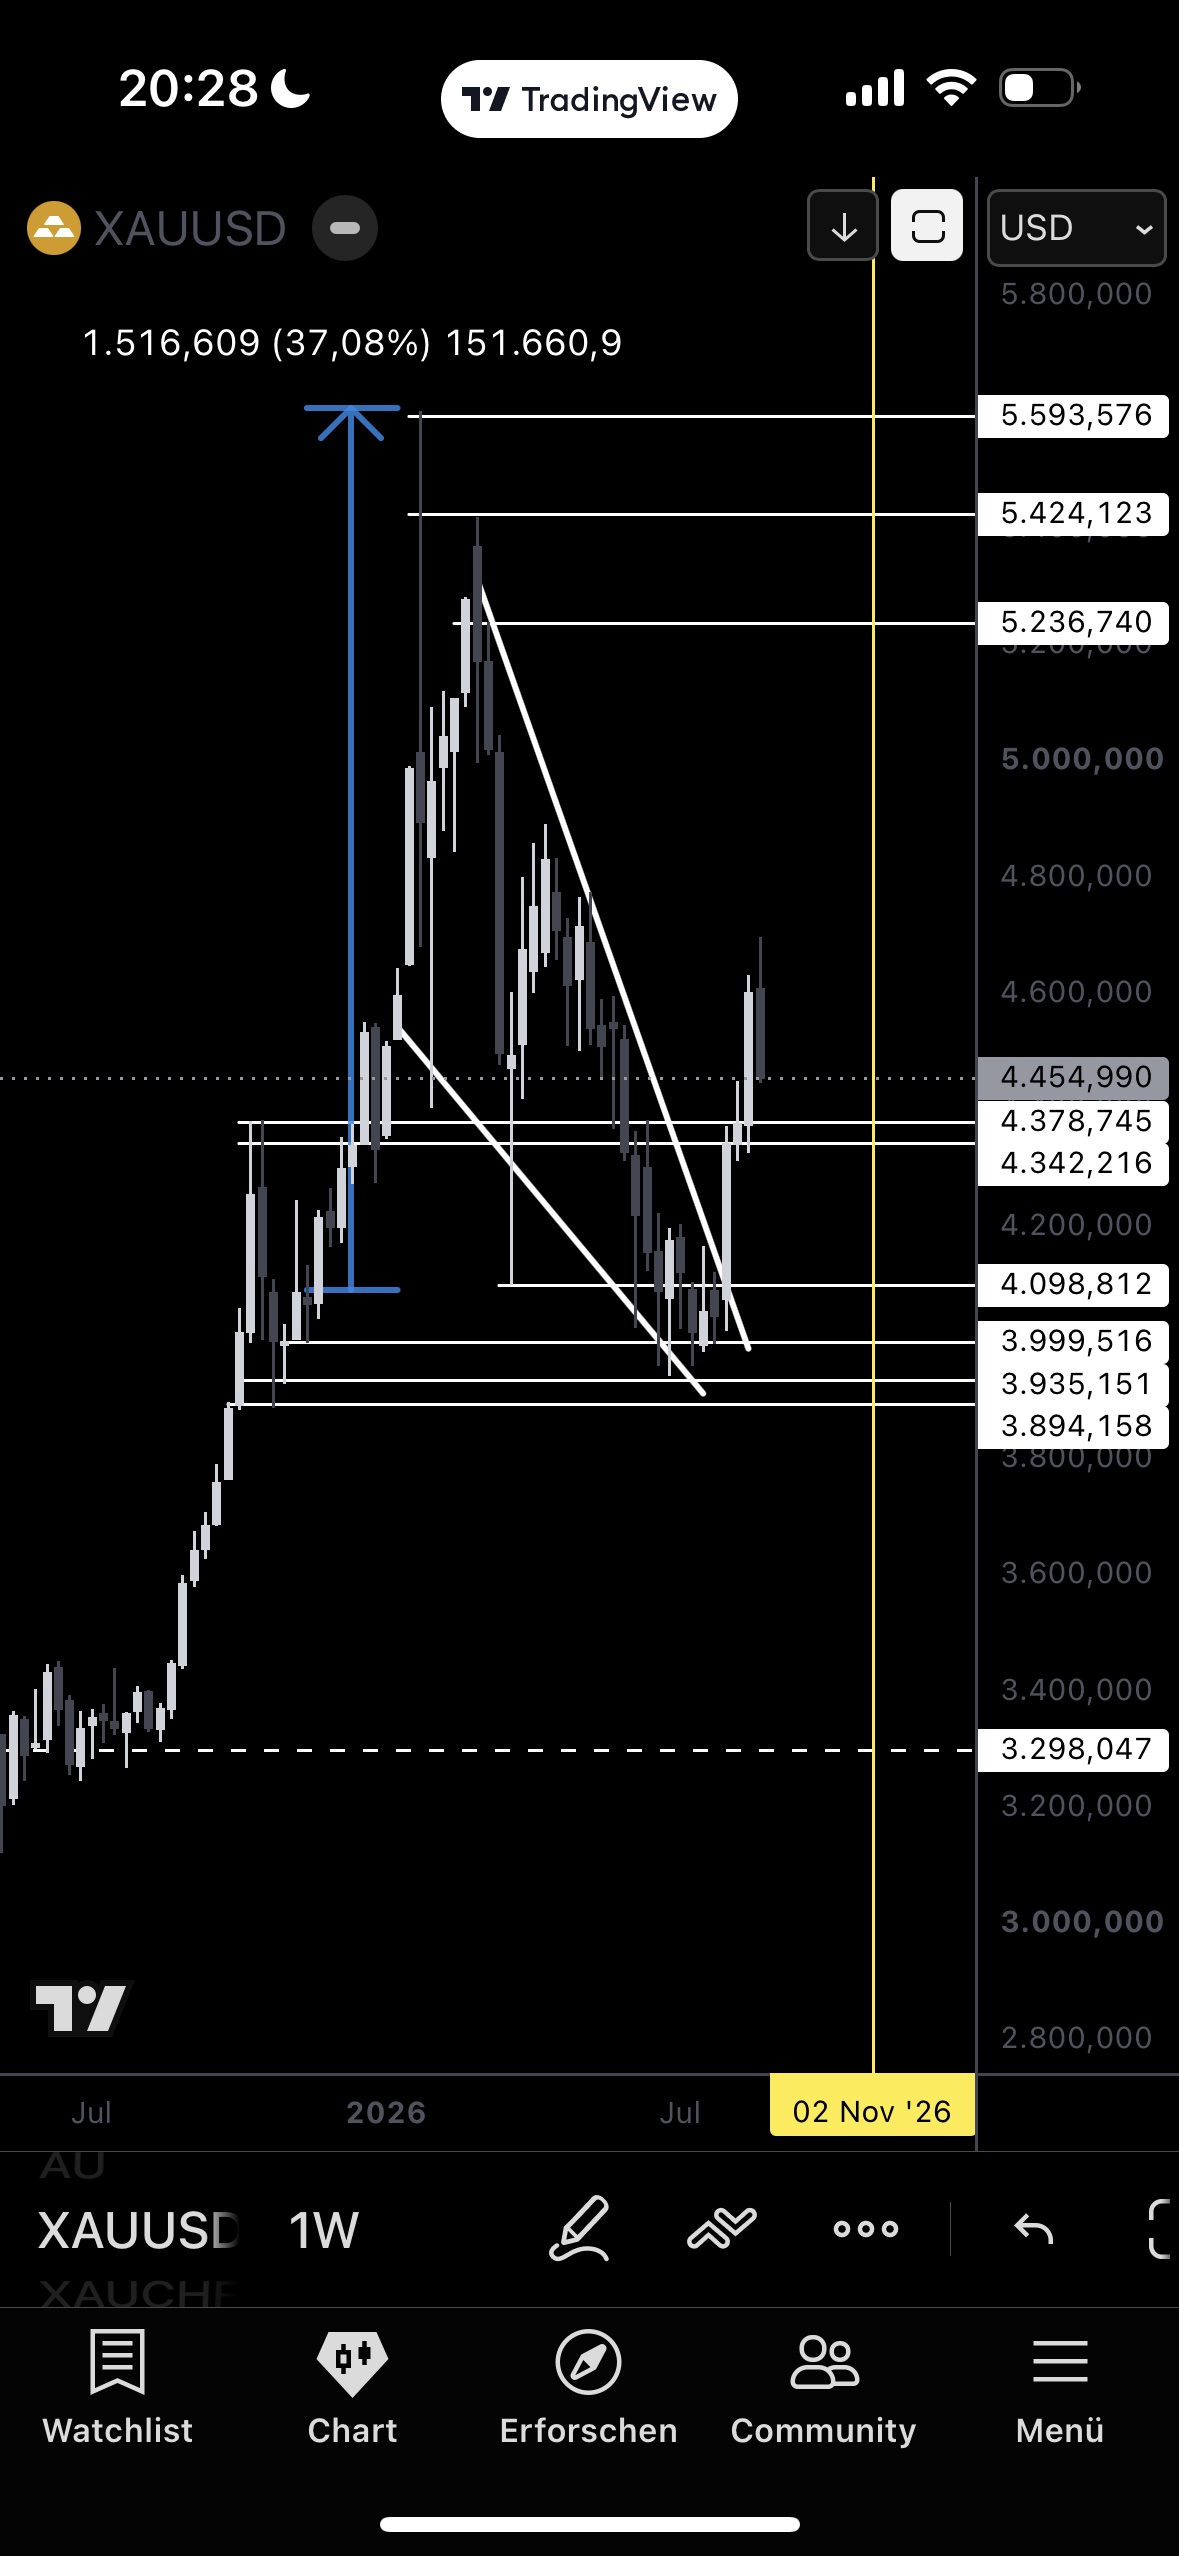
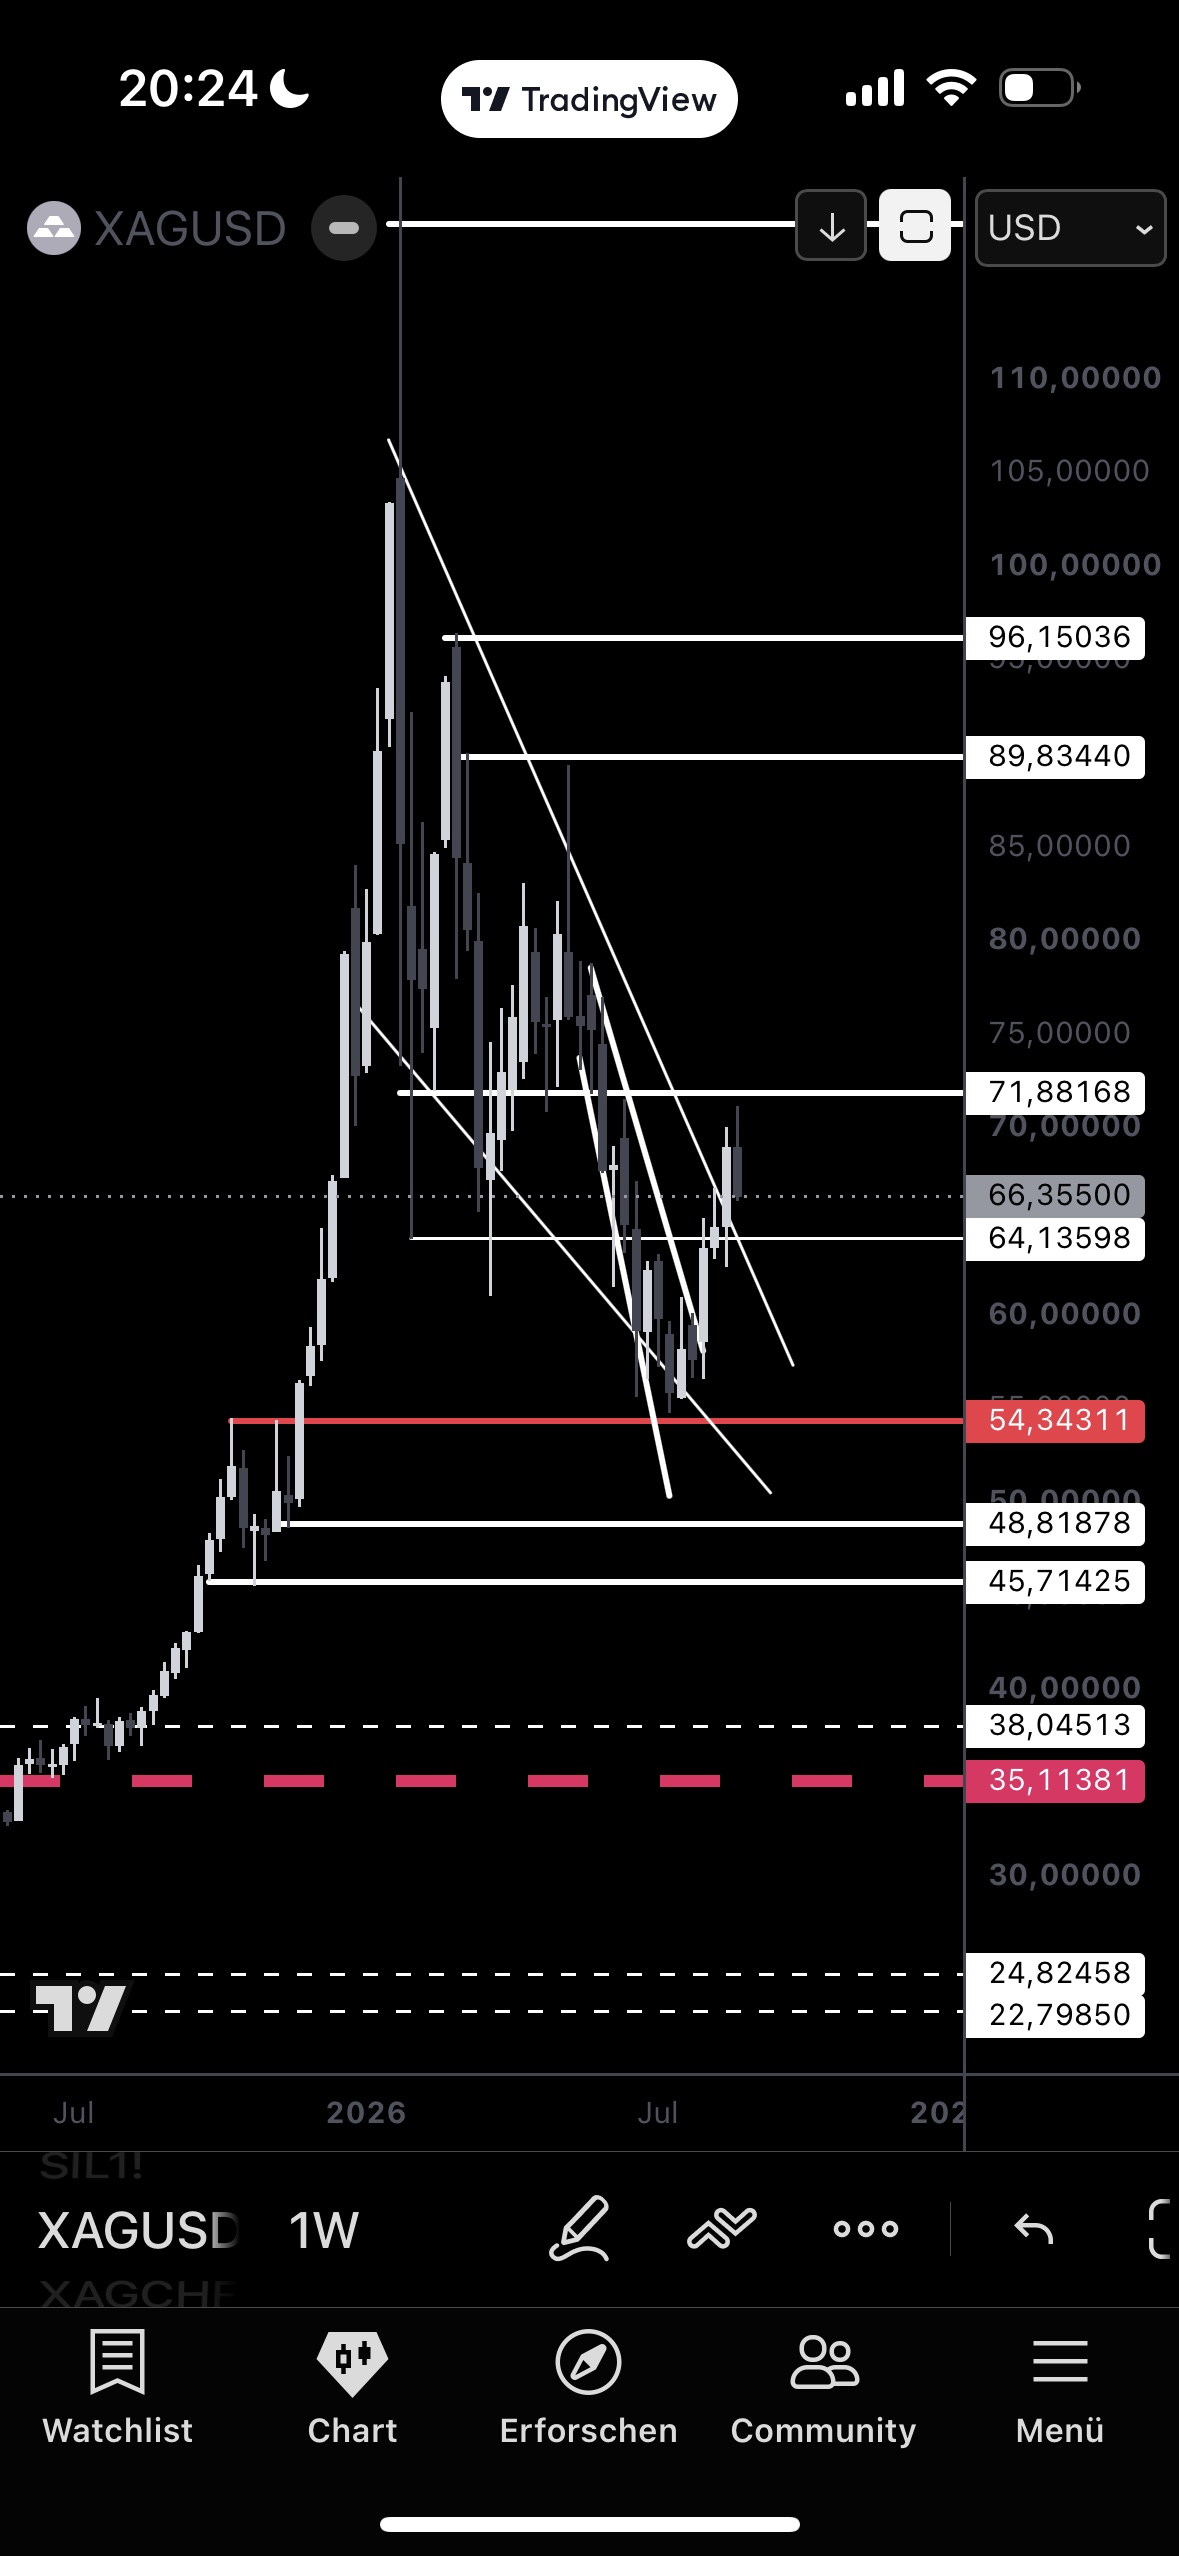
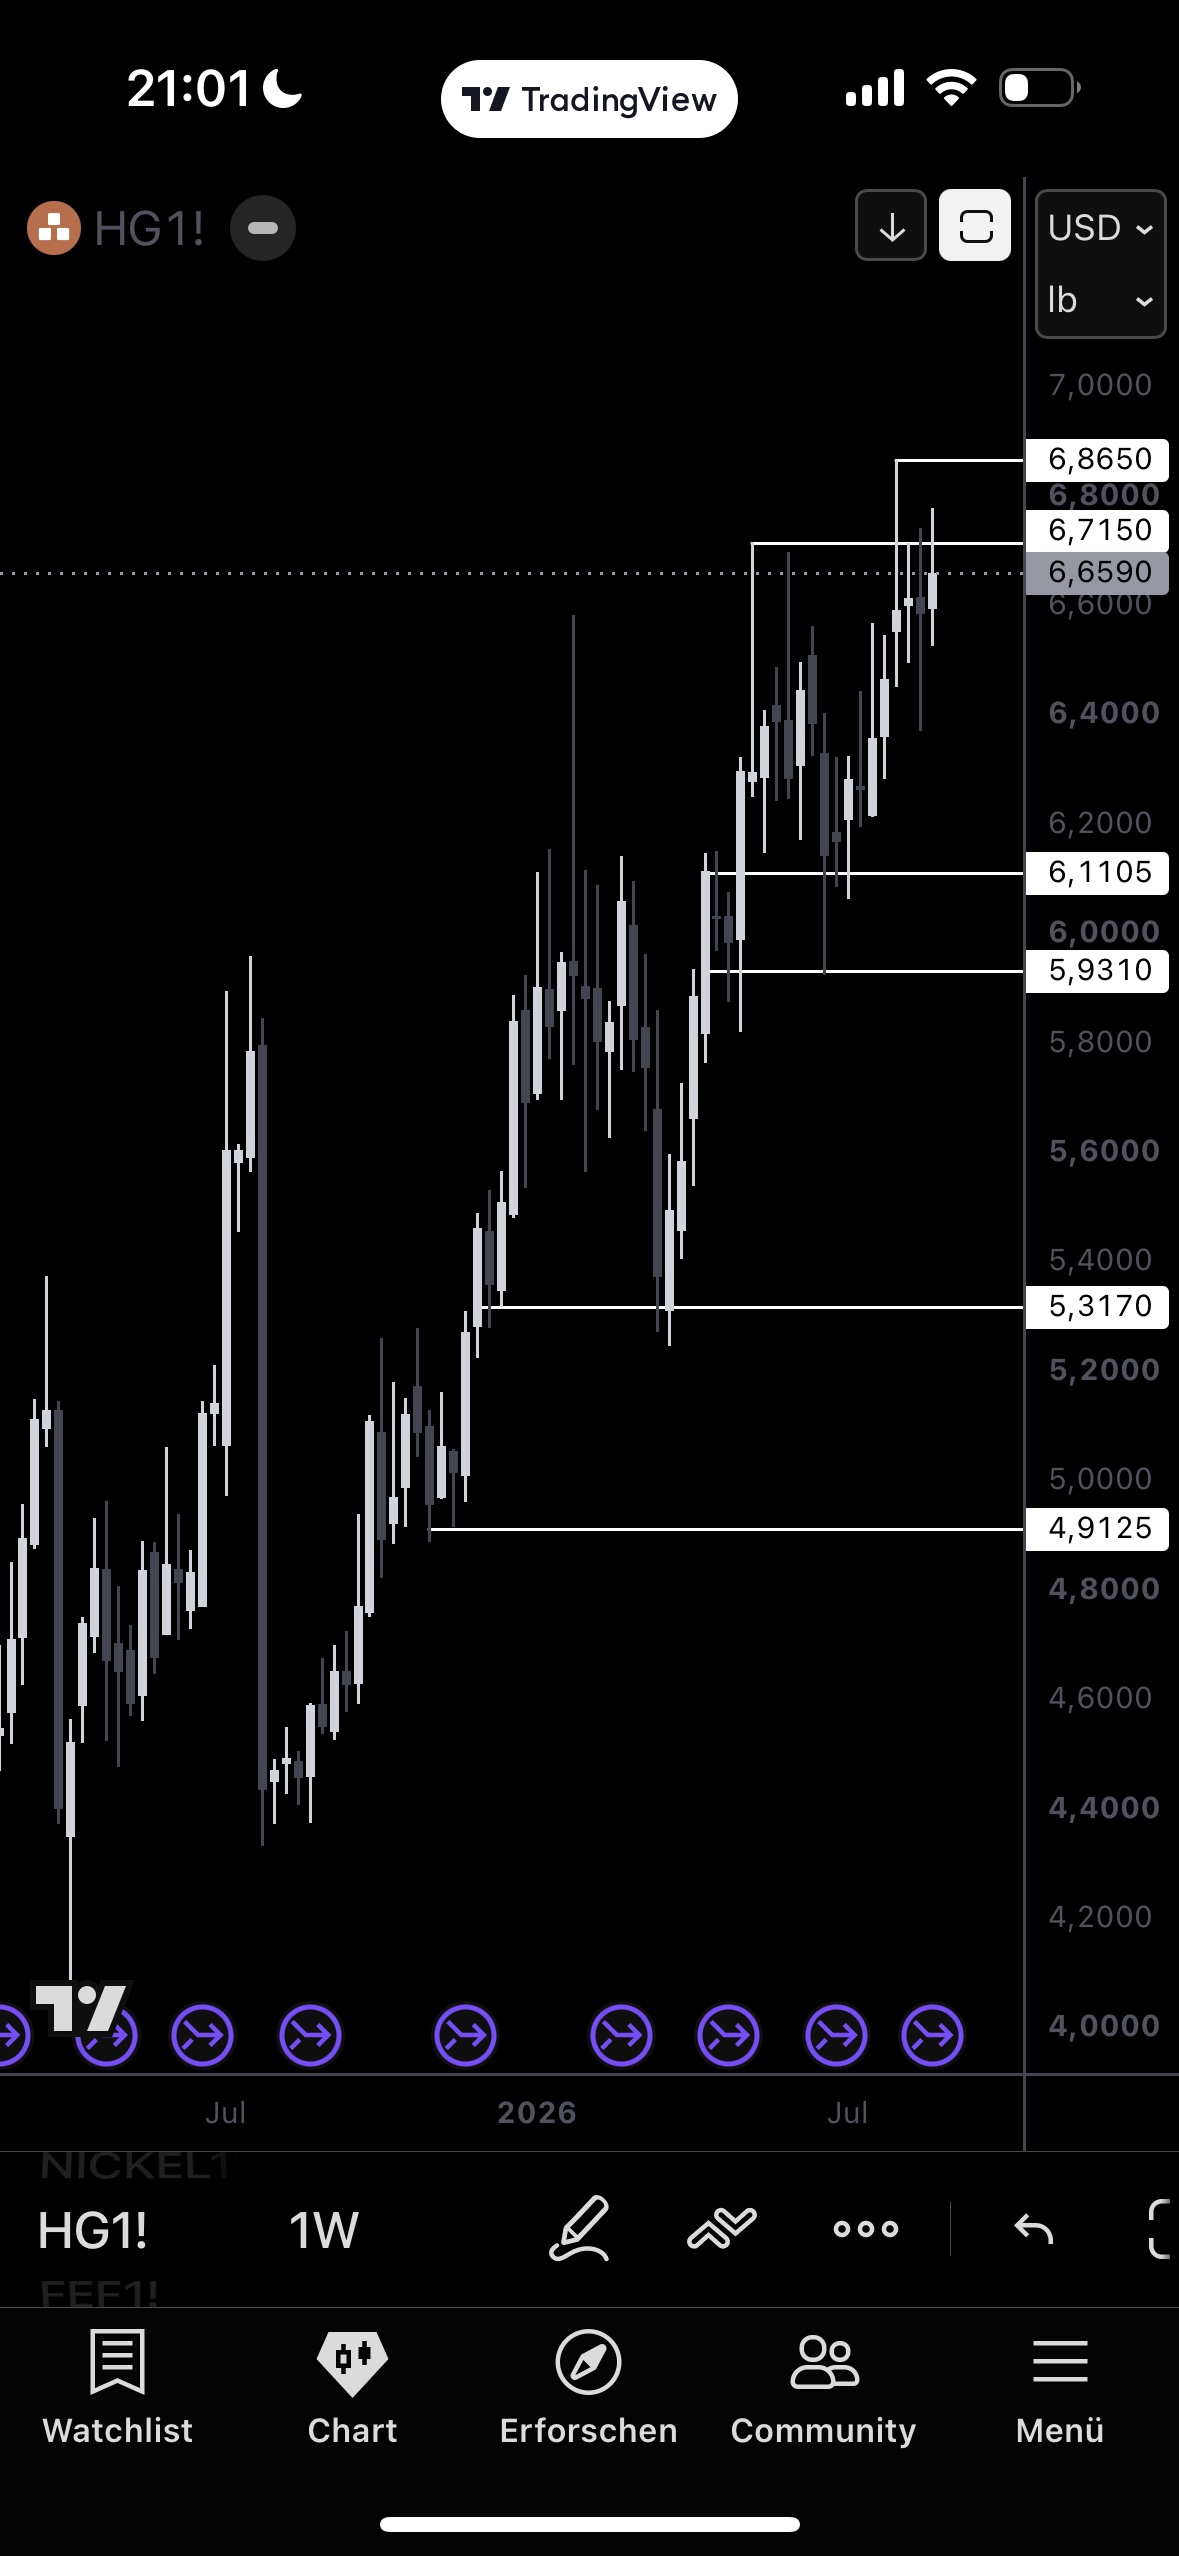
Silver (XAG): pulled back from 71.15 to ~68.8, bullish structure intact as long as 66.81–66.13 holds. Gold (XAU): correction after +37% back into the 4,444–4,455 cluster zone, still bullish above 4,540/4,511. Copper: consolidating between 6.64 and 6.70, uptrend intact, trigger 6.7150/6.8650 not yet confirmed — FCX remains the leader, not the follower.
Next week's trigger points: US10Y invalidation (>4.746–4.75%) · US30Y rollover (<5.167%) · DXY >100.059–100.351 · silver holding 66.13–66.81 · gold holding 4,511–4,540 · copper breakout 6.7150/6.8650 · NFP Sep 4 · FOMC Sep 15–16.
Newmont: new ATH, then the test.
1D
4H
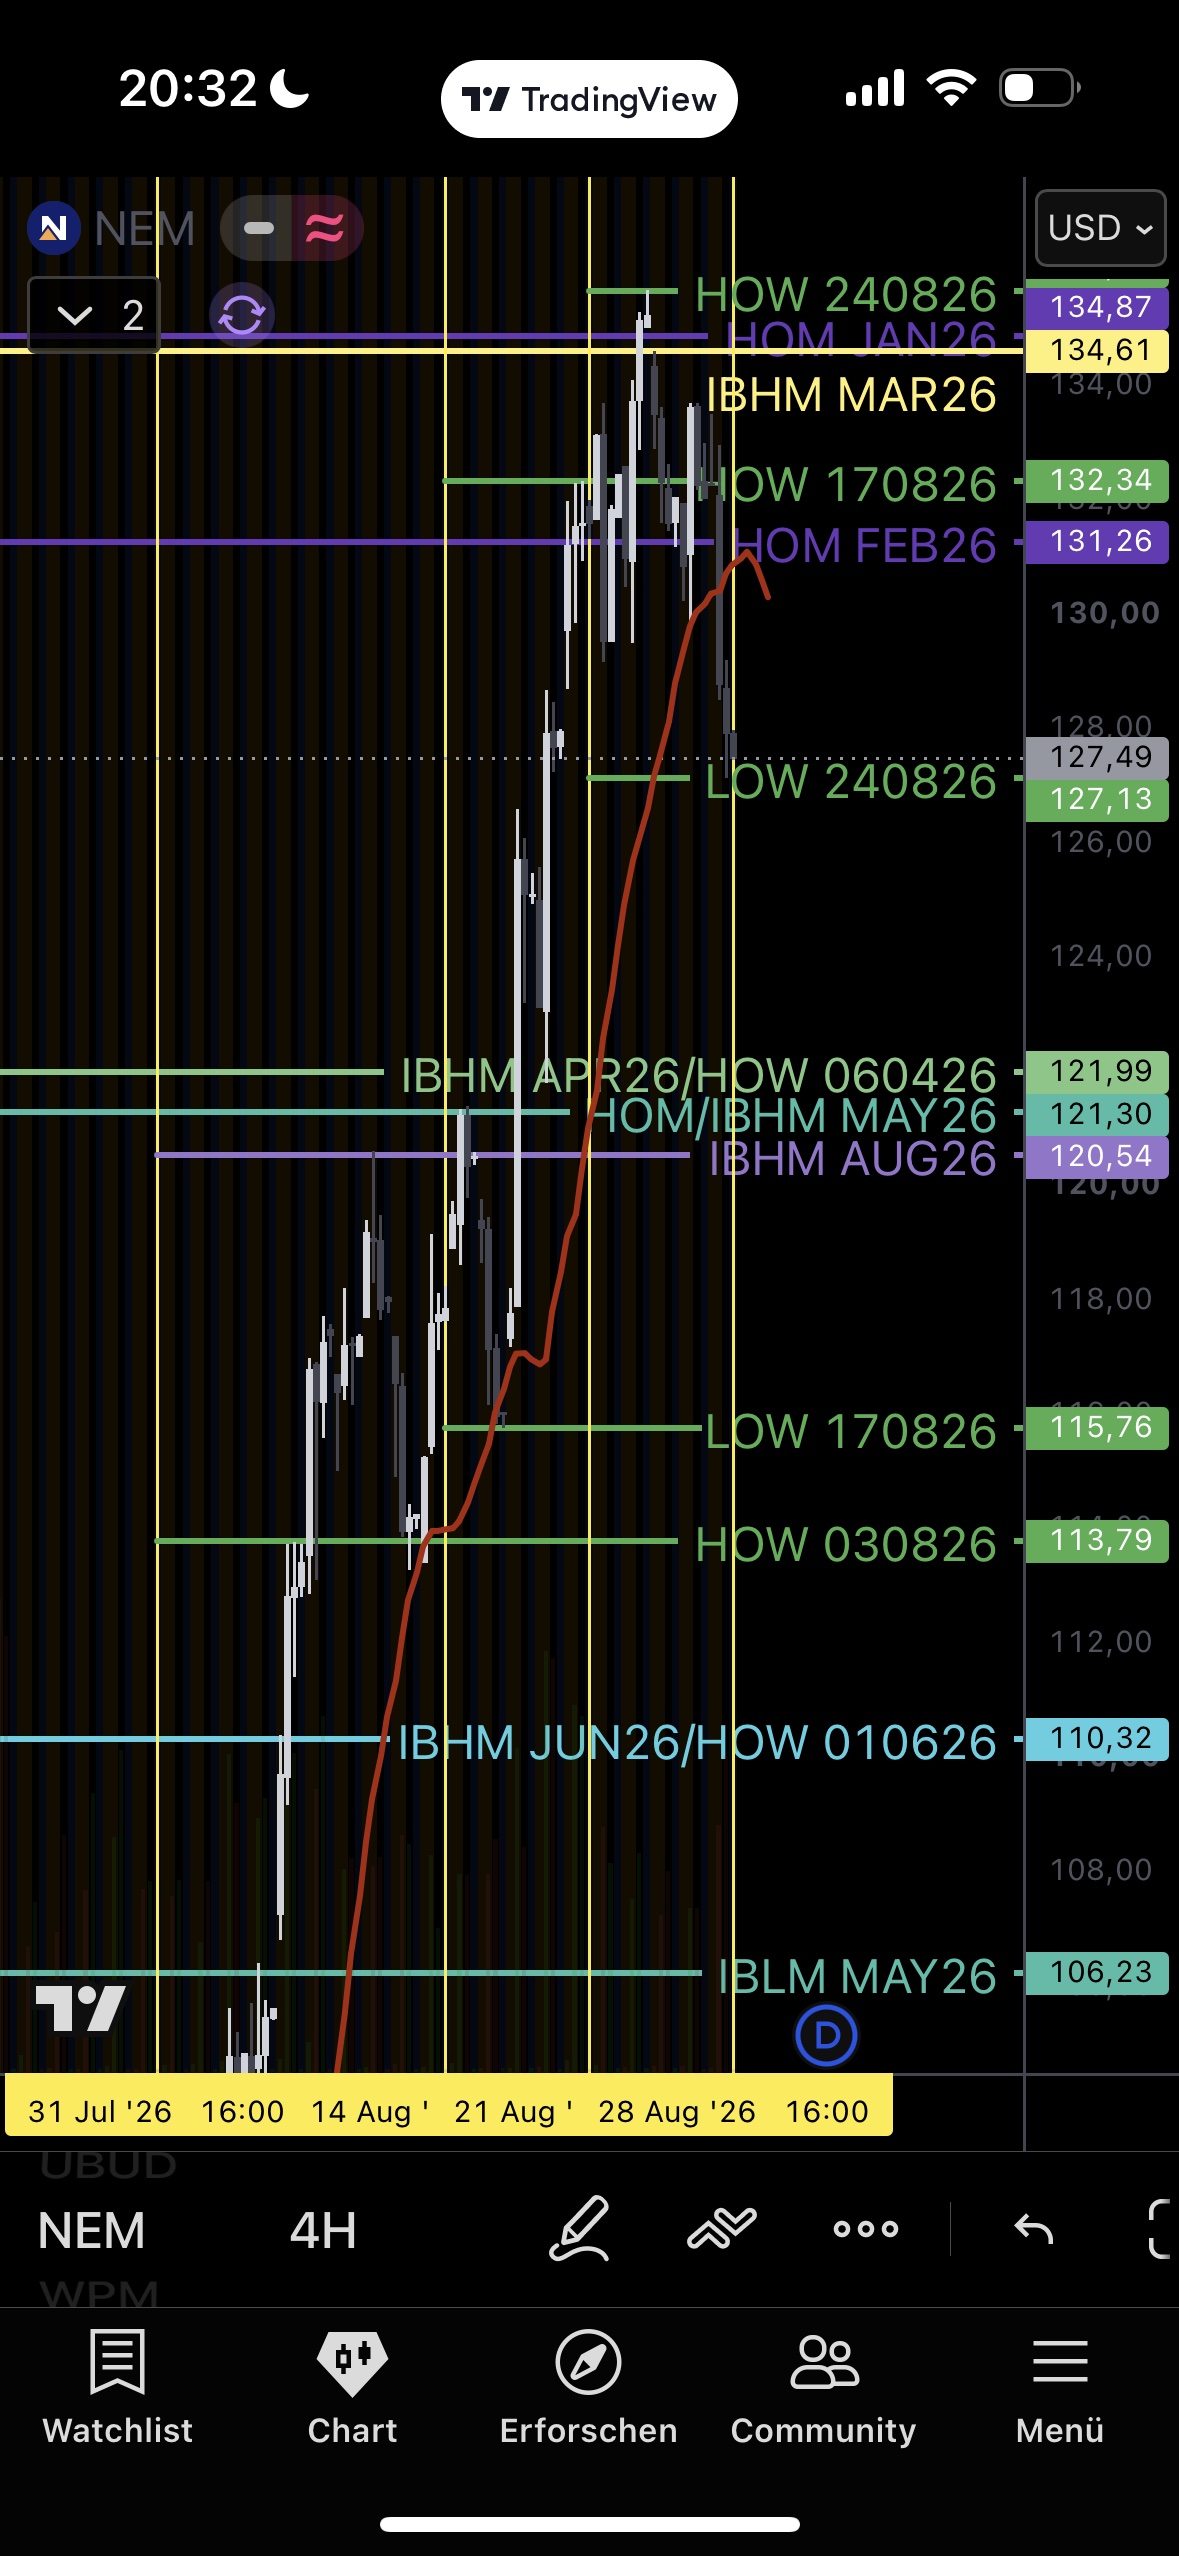
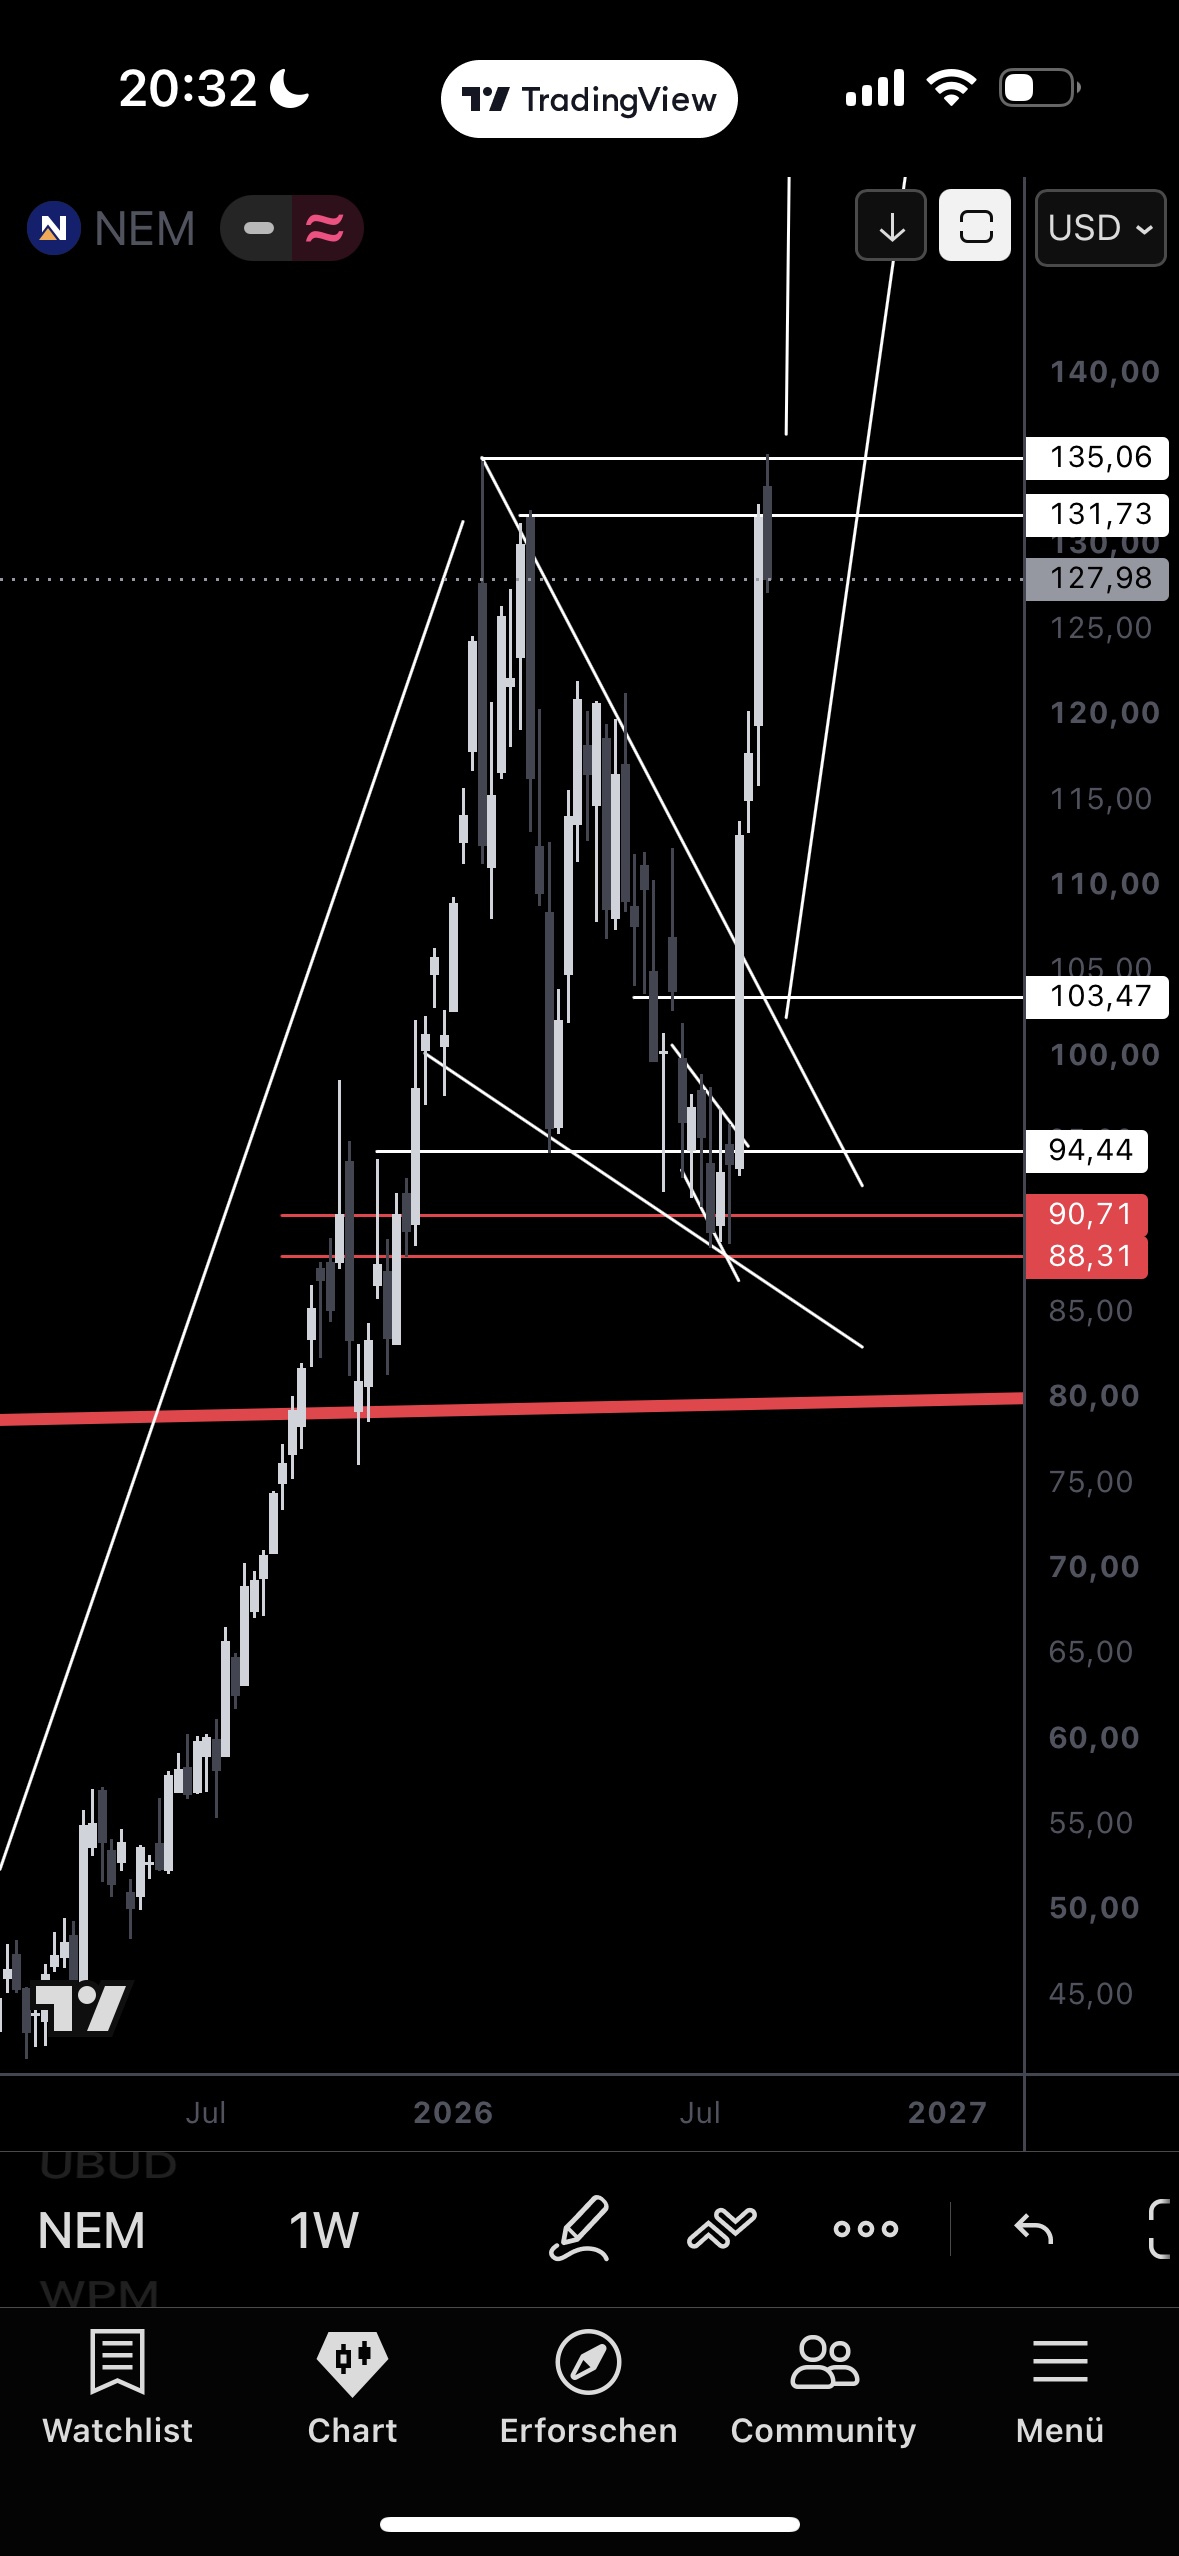
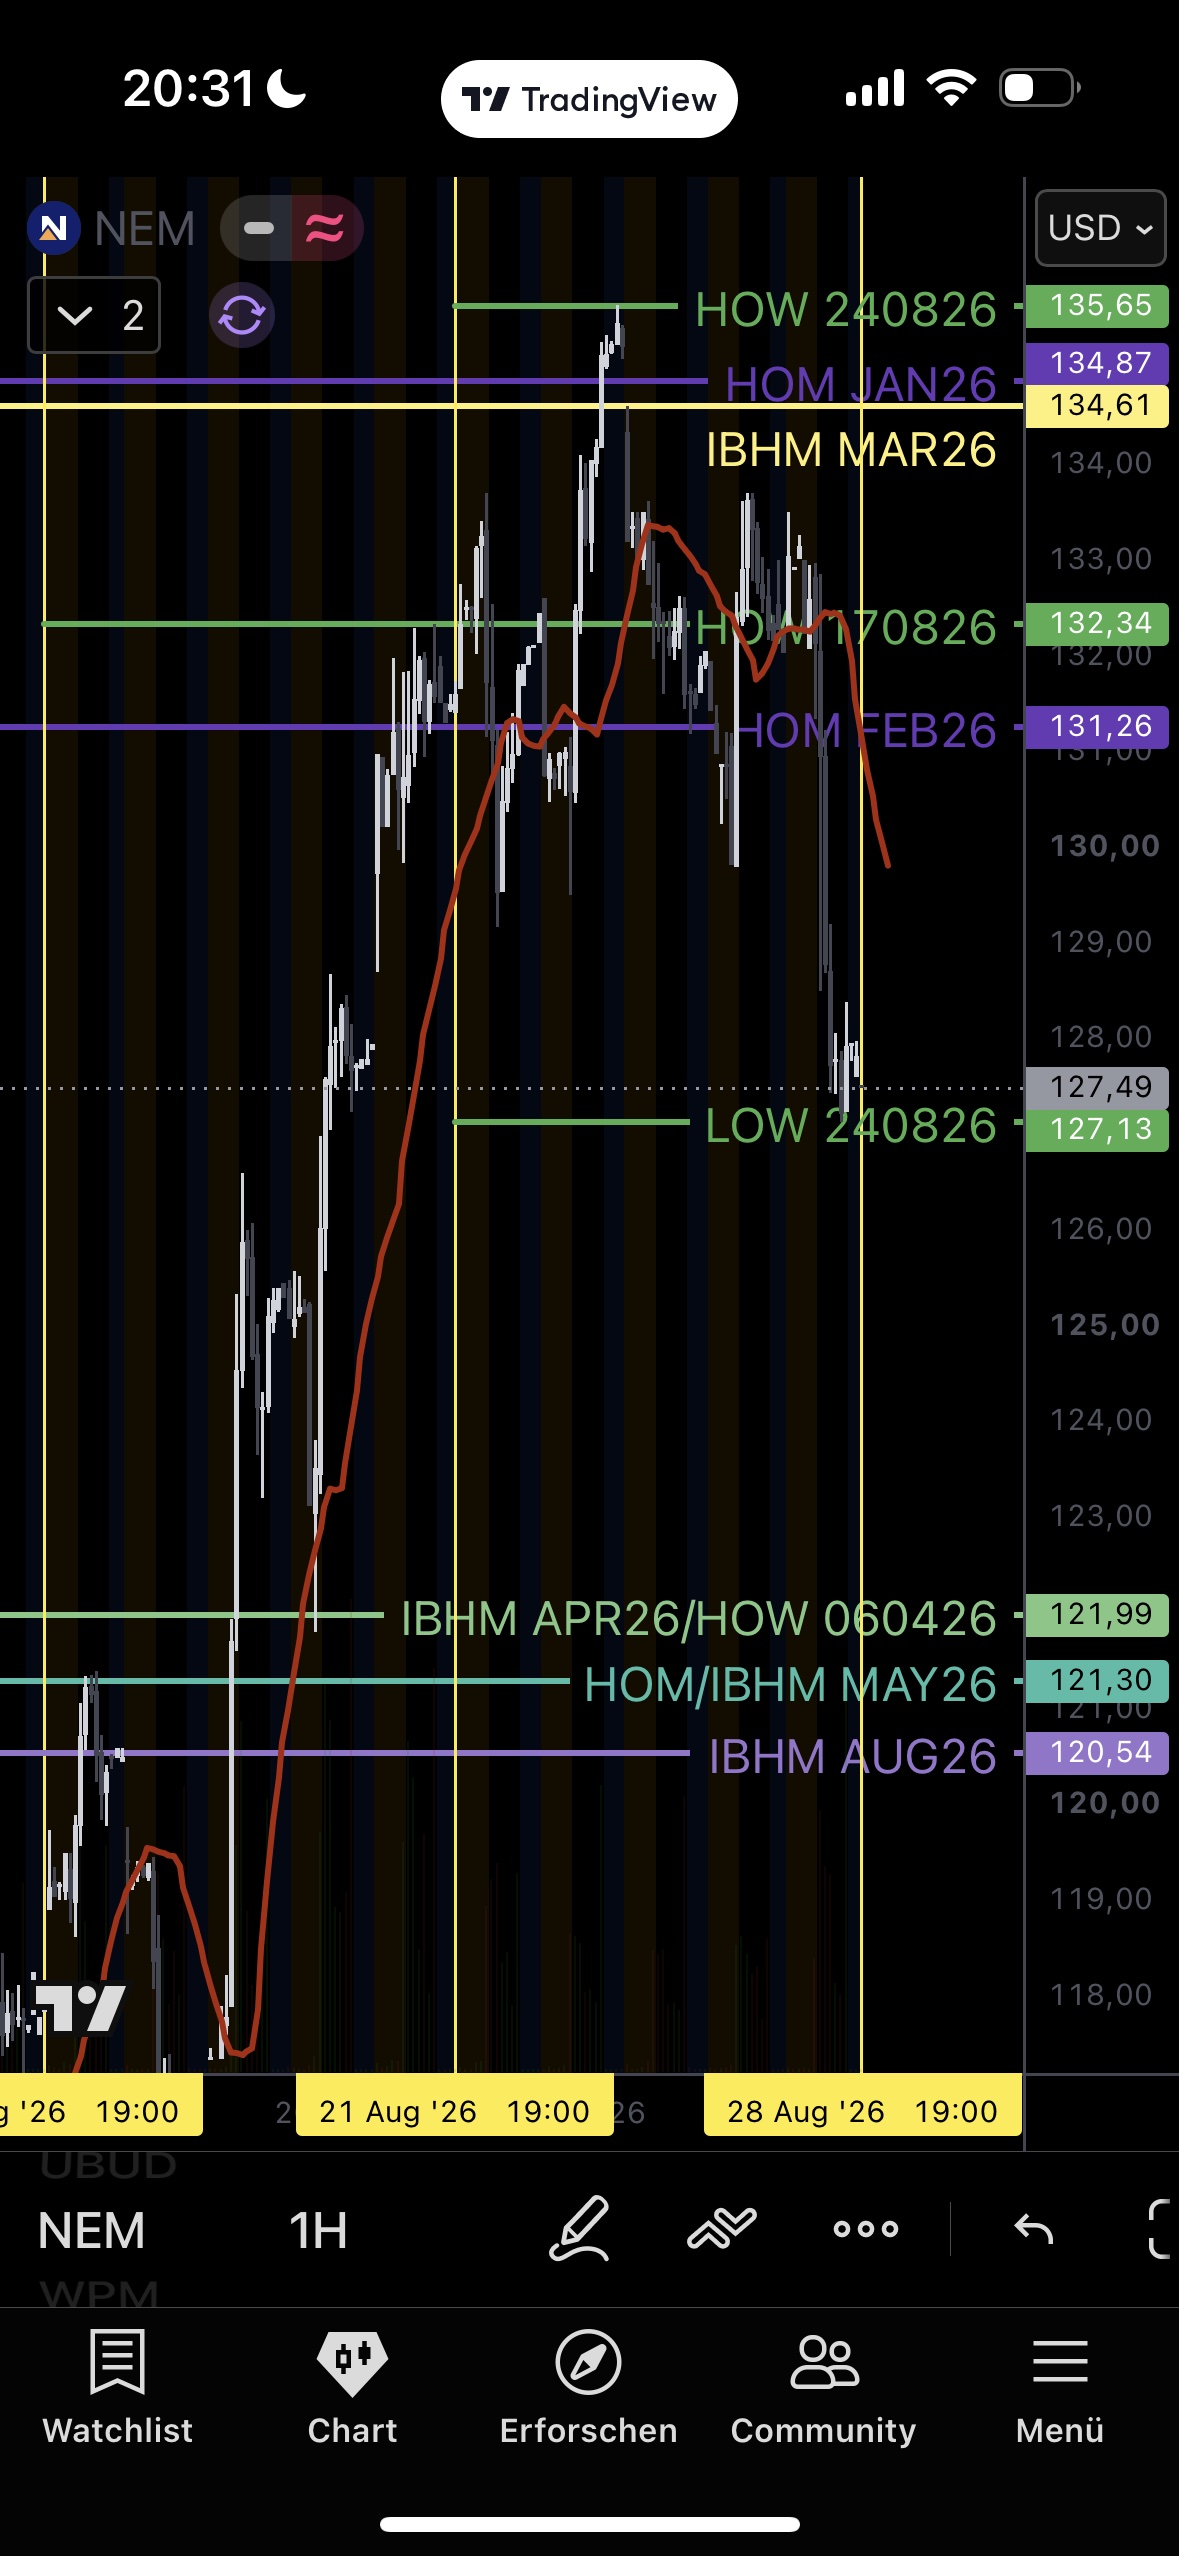
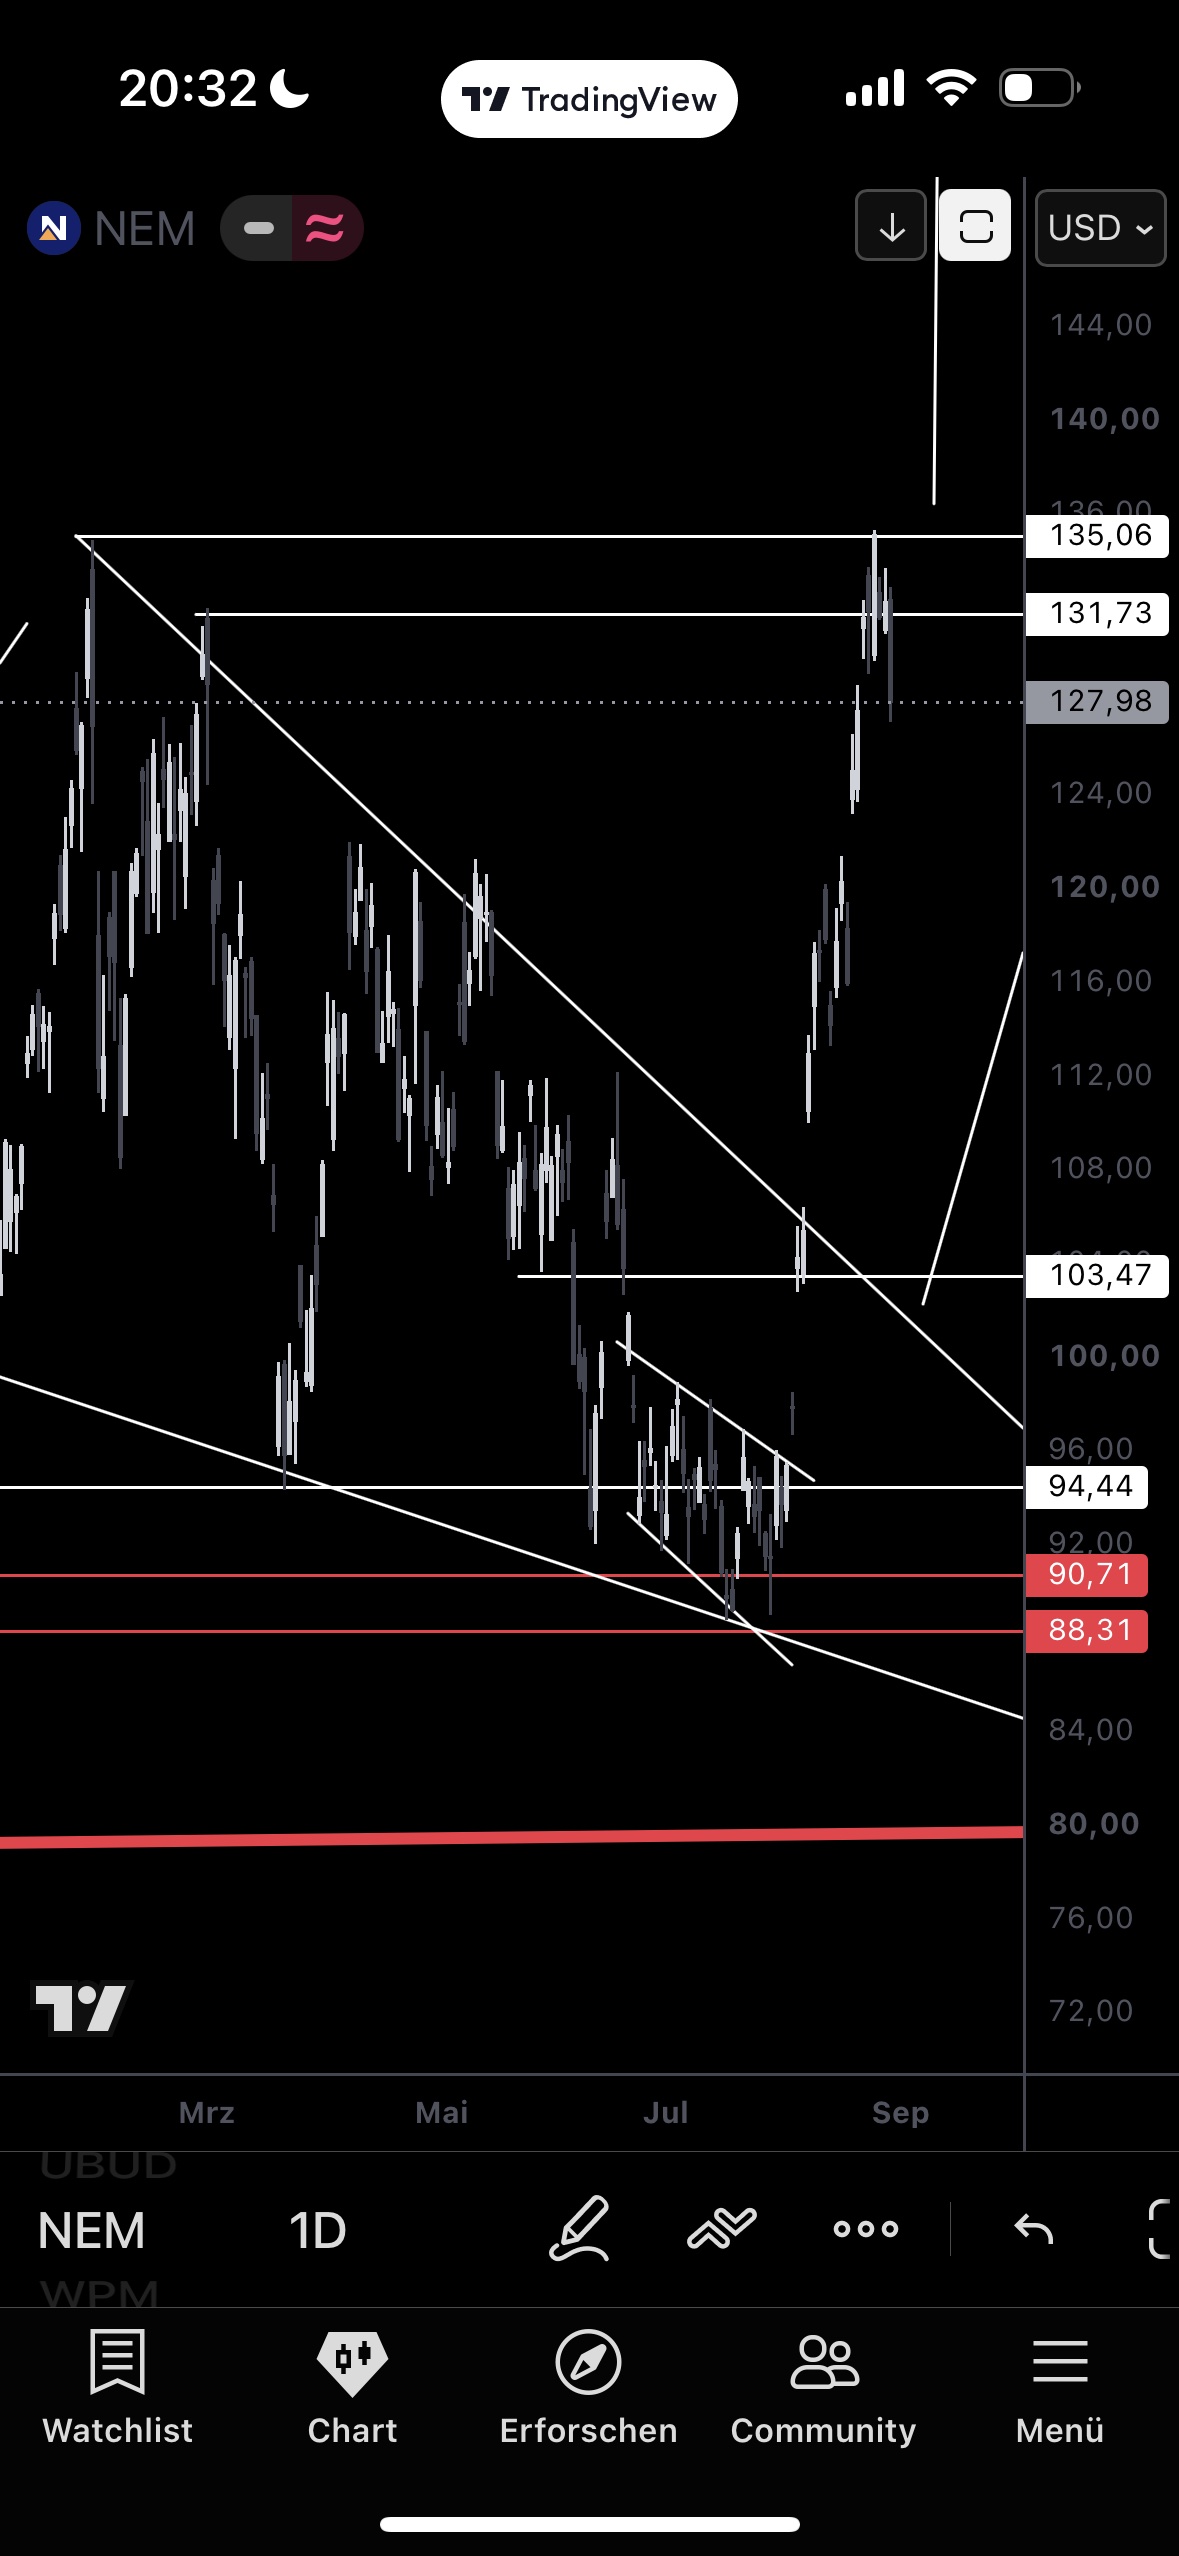
Price slightly overtook the old ATH (135.06 → high 135.65) on Aug 24 — the first nominal all-time high since the correction began in January. A clear pullback has followed, consolidating 127.13–131.60. This is the first real test of whether the move continues after hitting target: $127.13 has to hold for the continuation thesis. Open question: whether TP1 actually filled on the brief touch above $135.
Agnico Eagle: the first real breather.
1D
4H
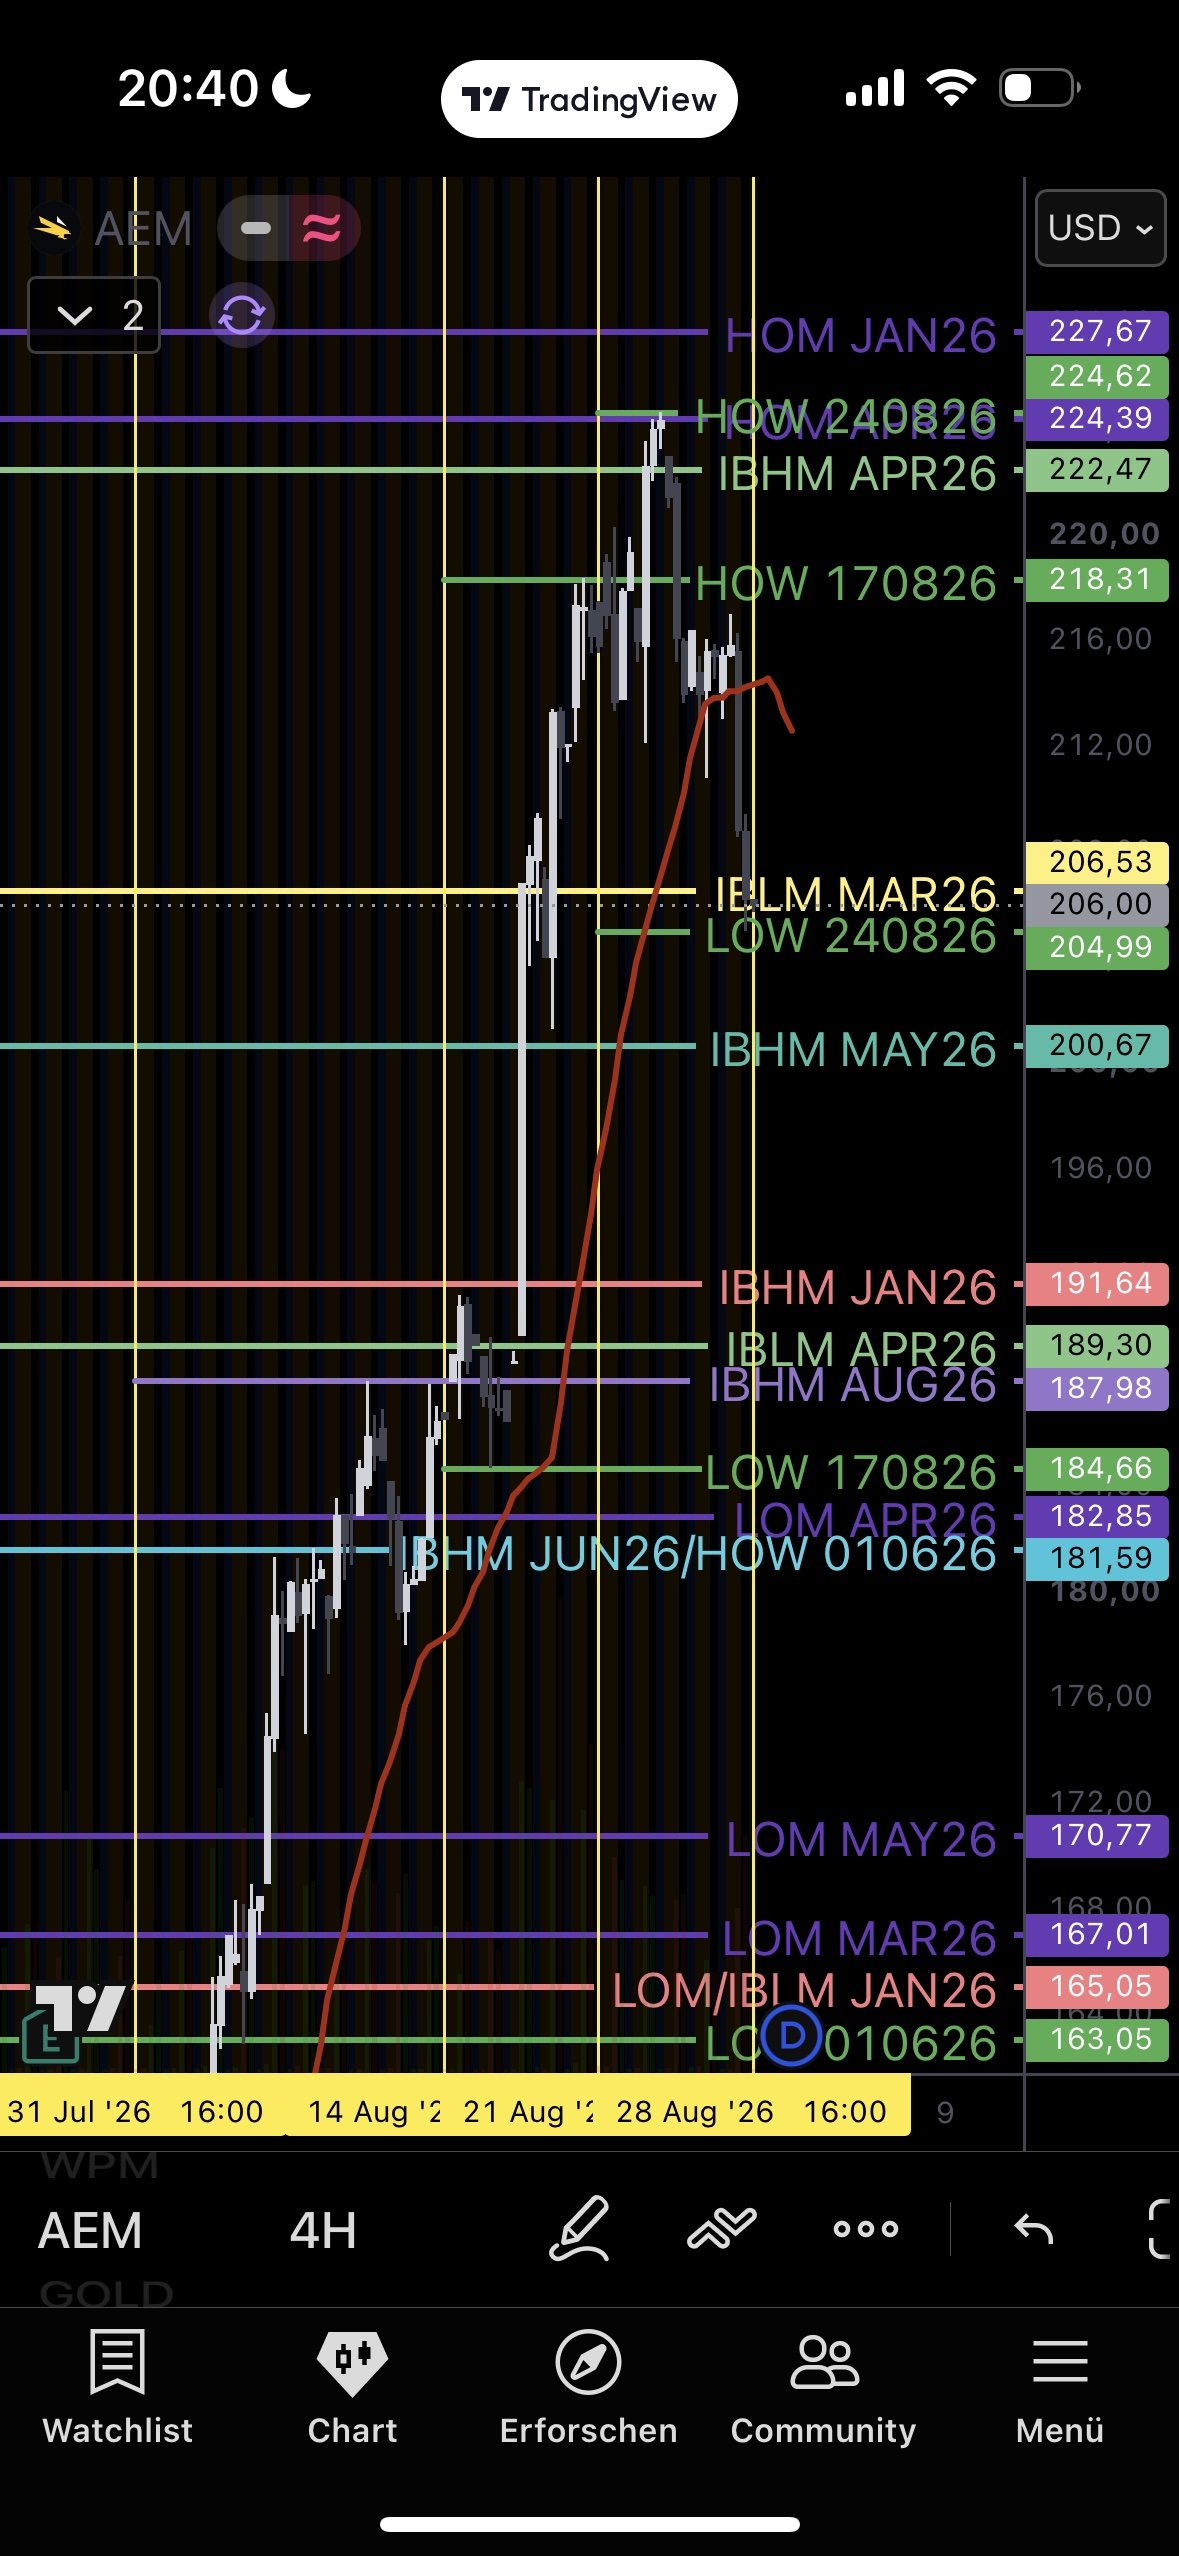
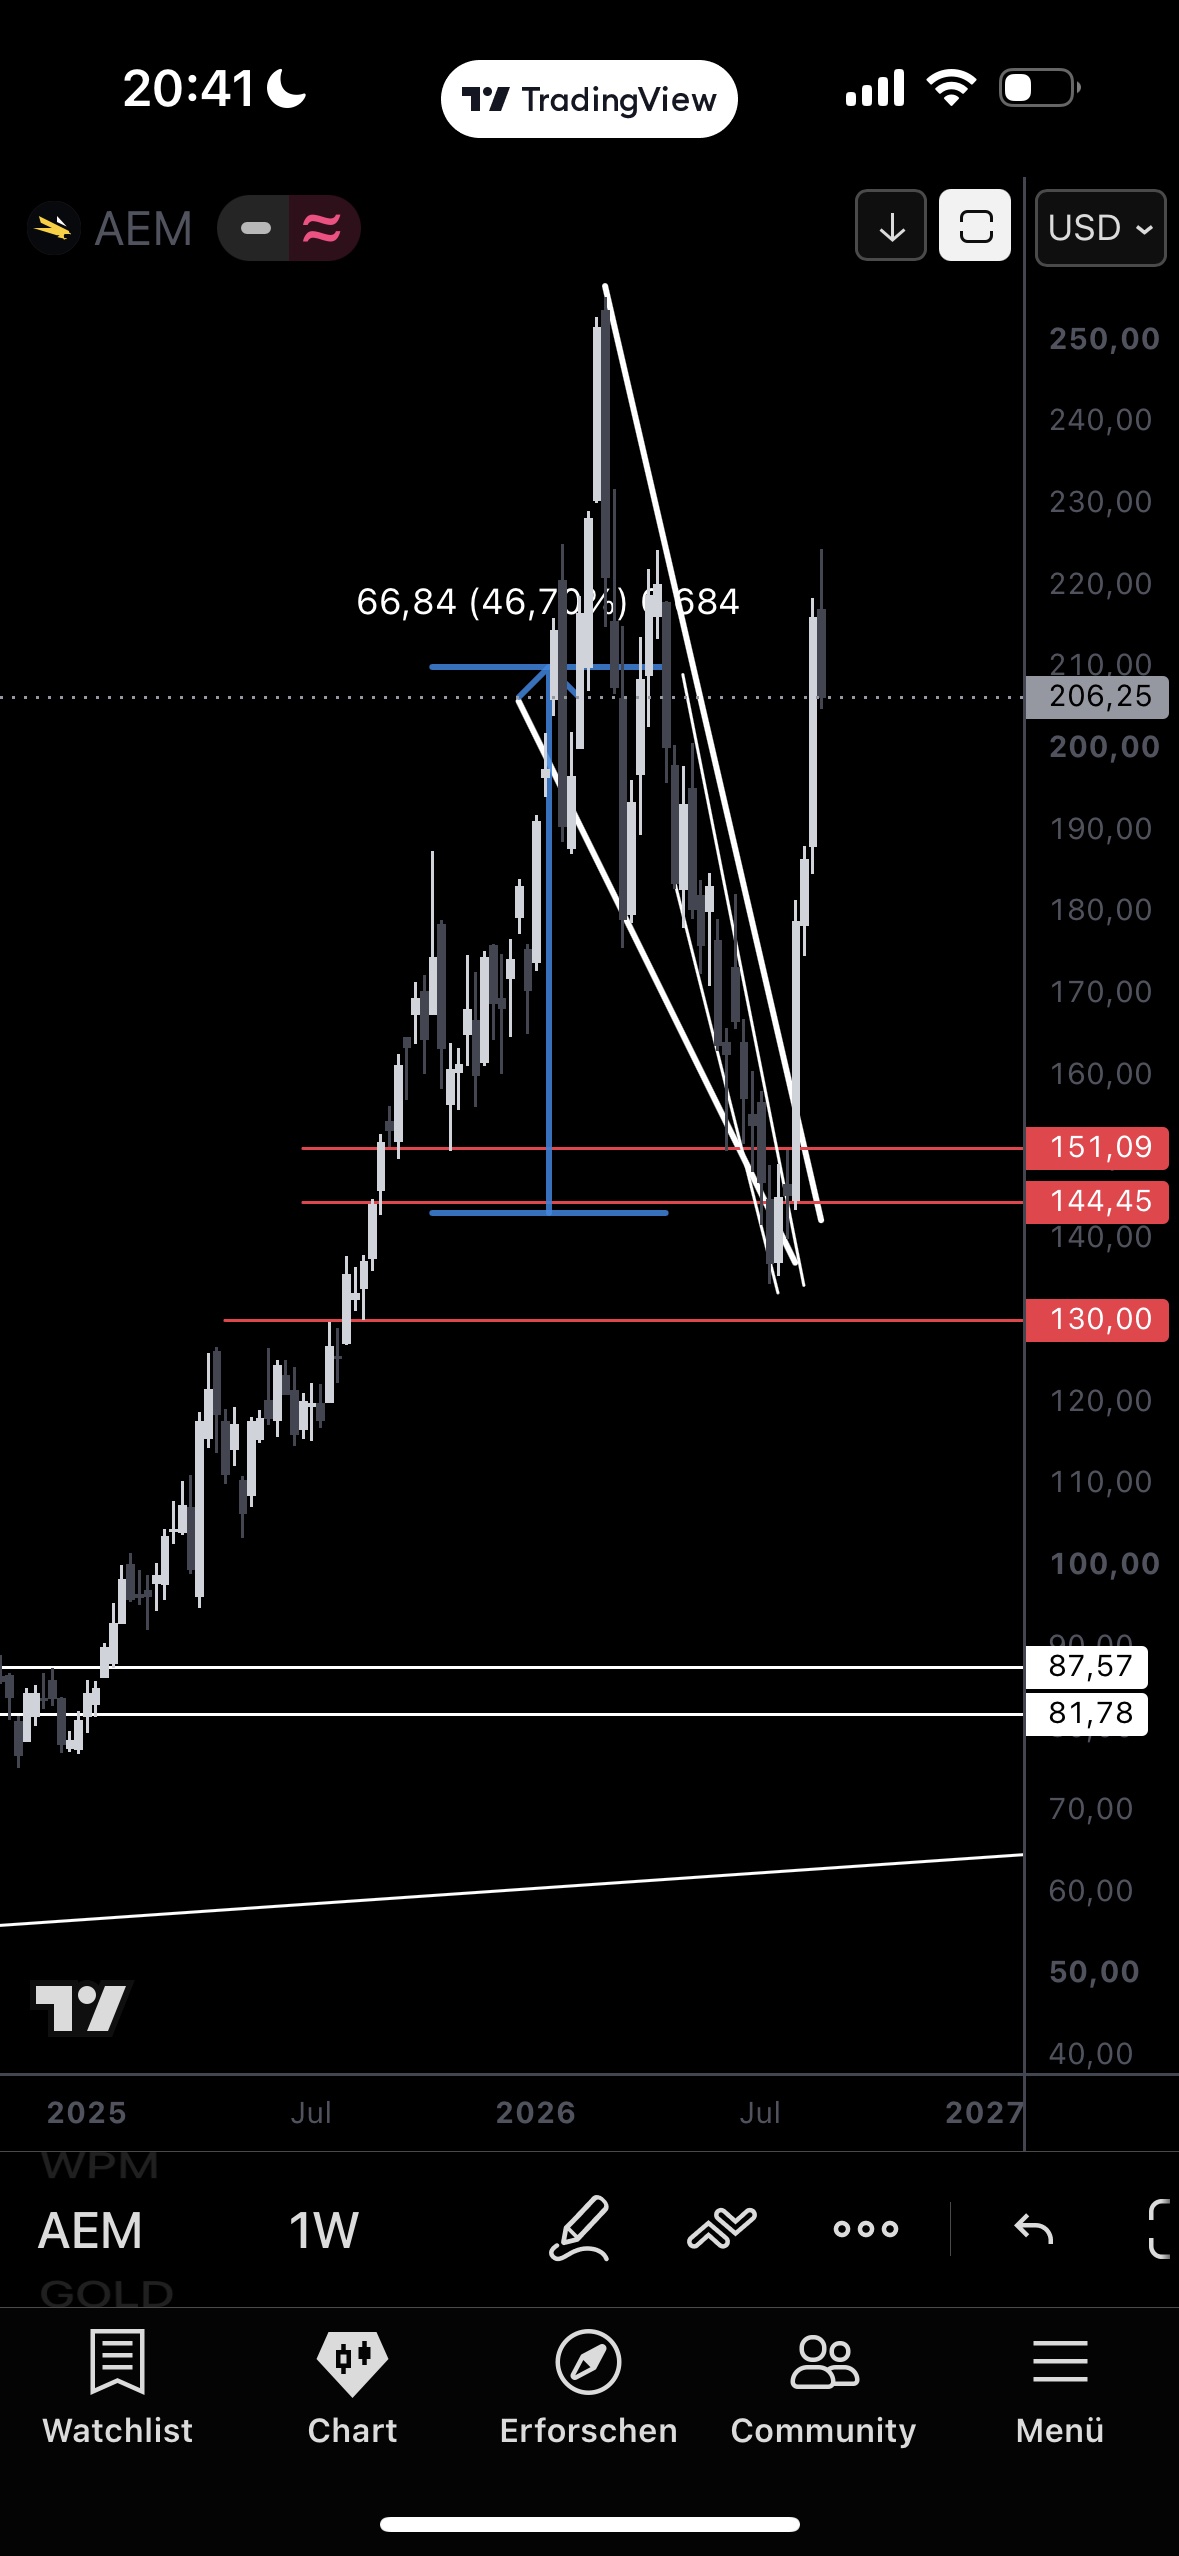
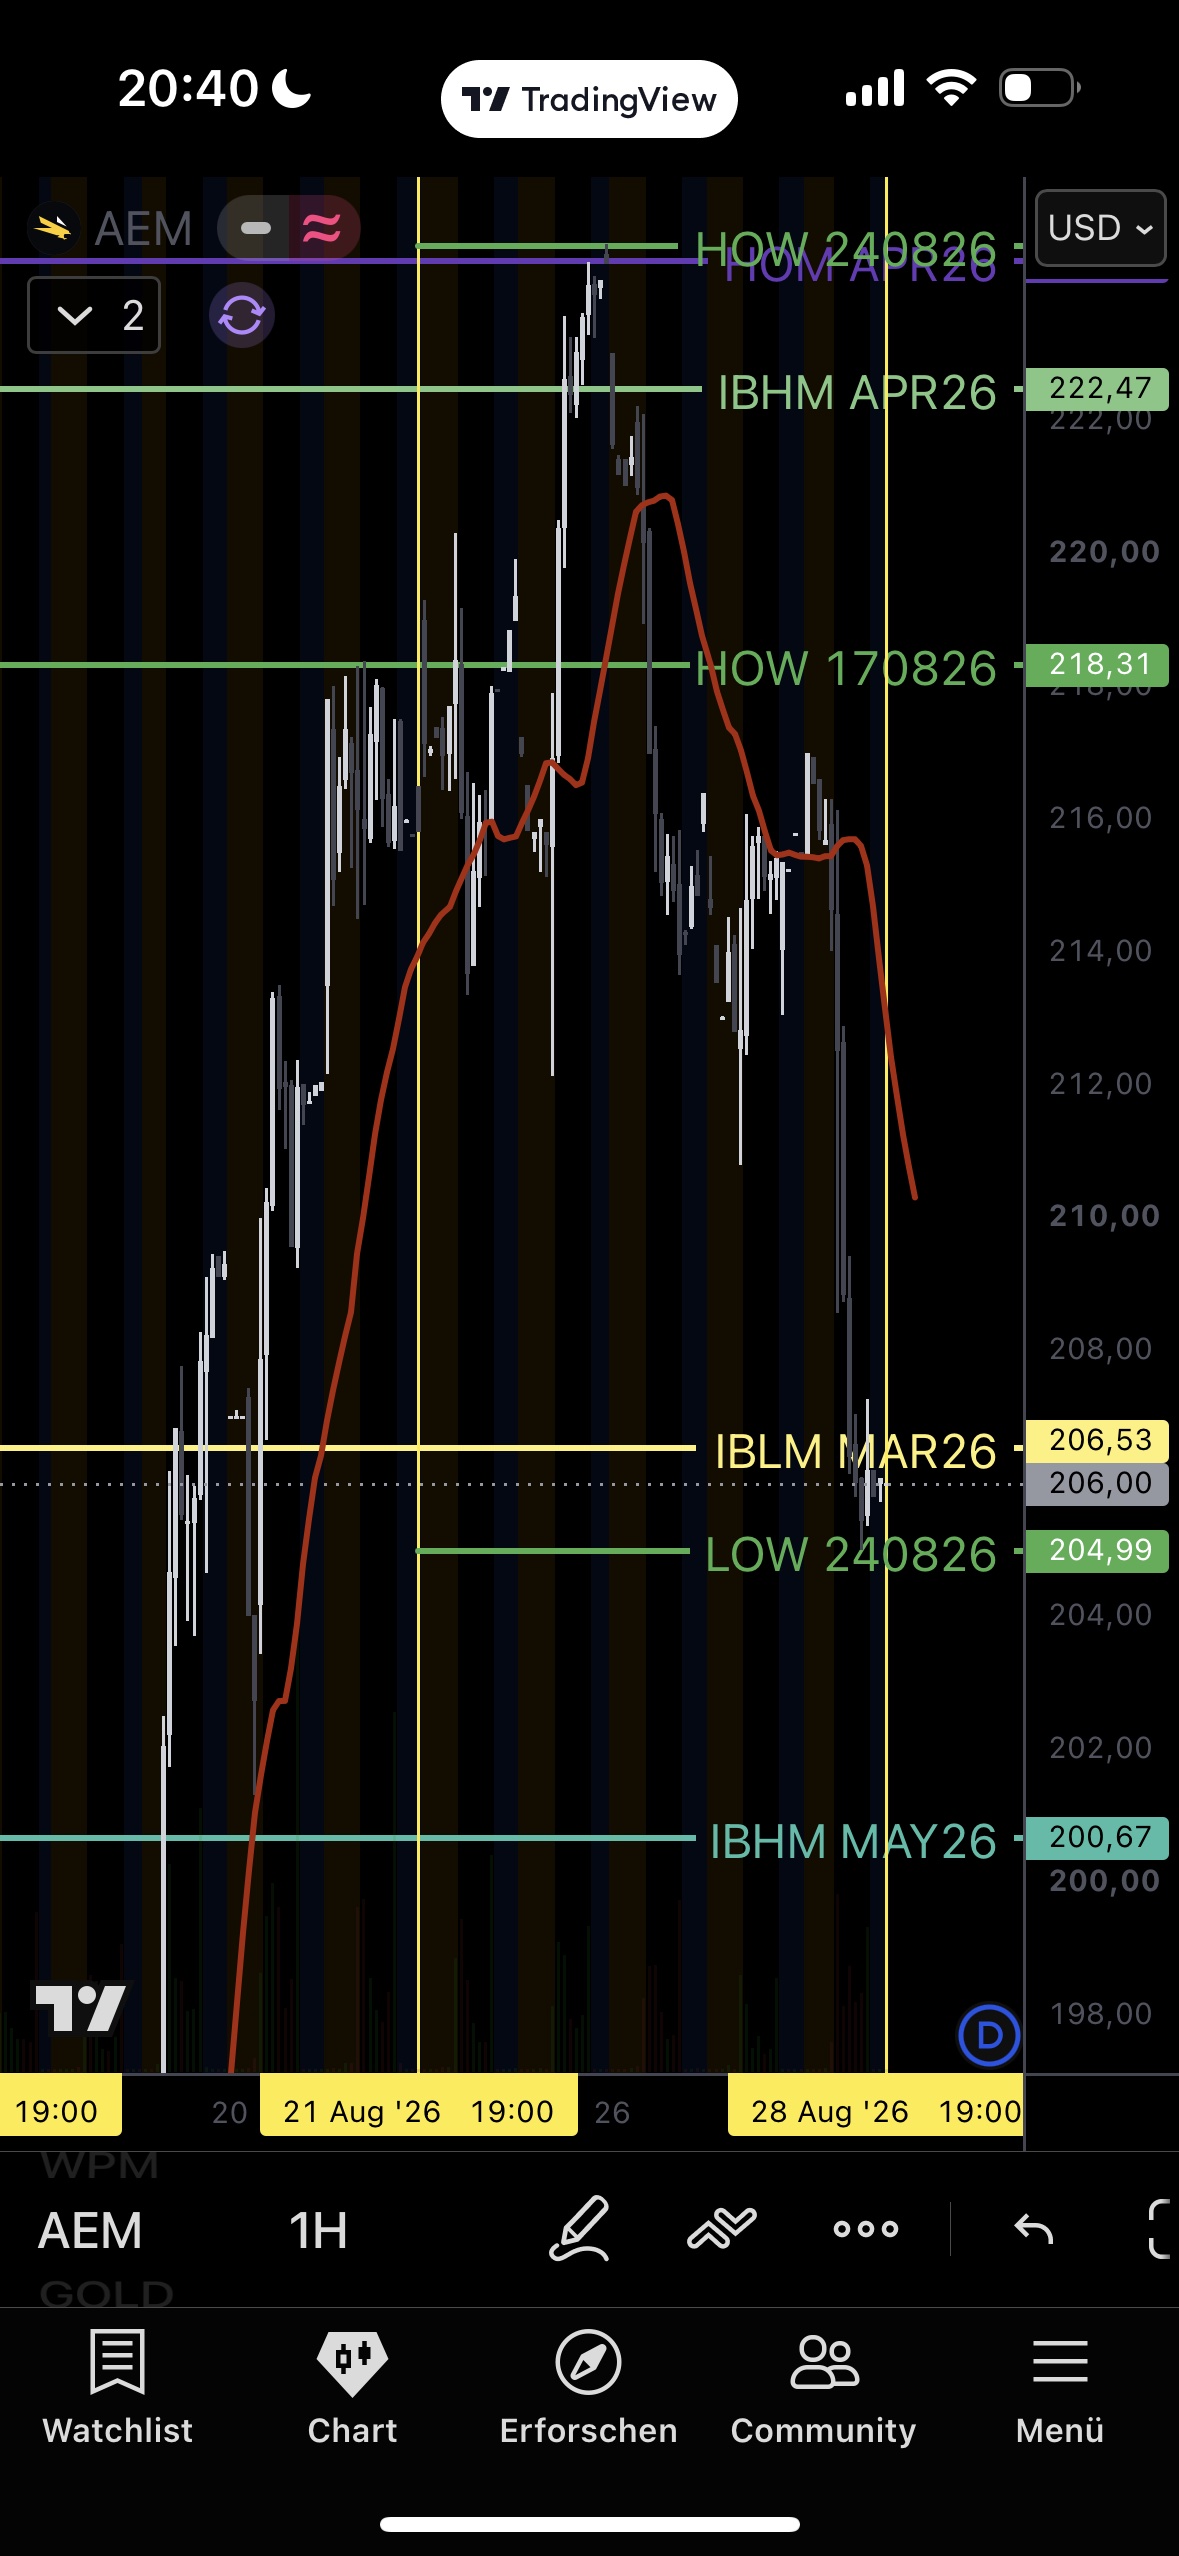
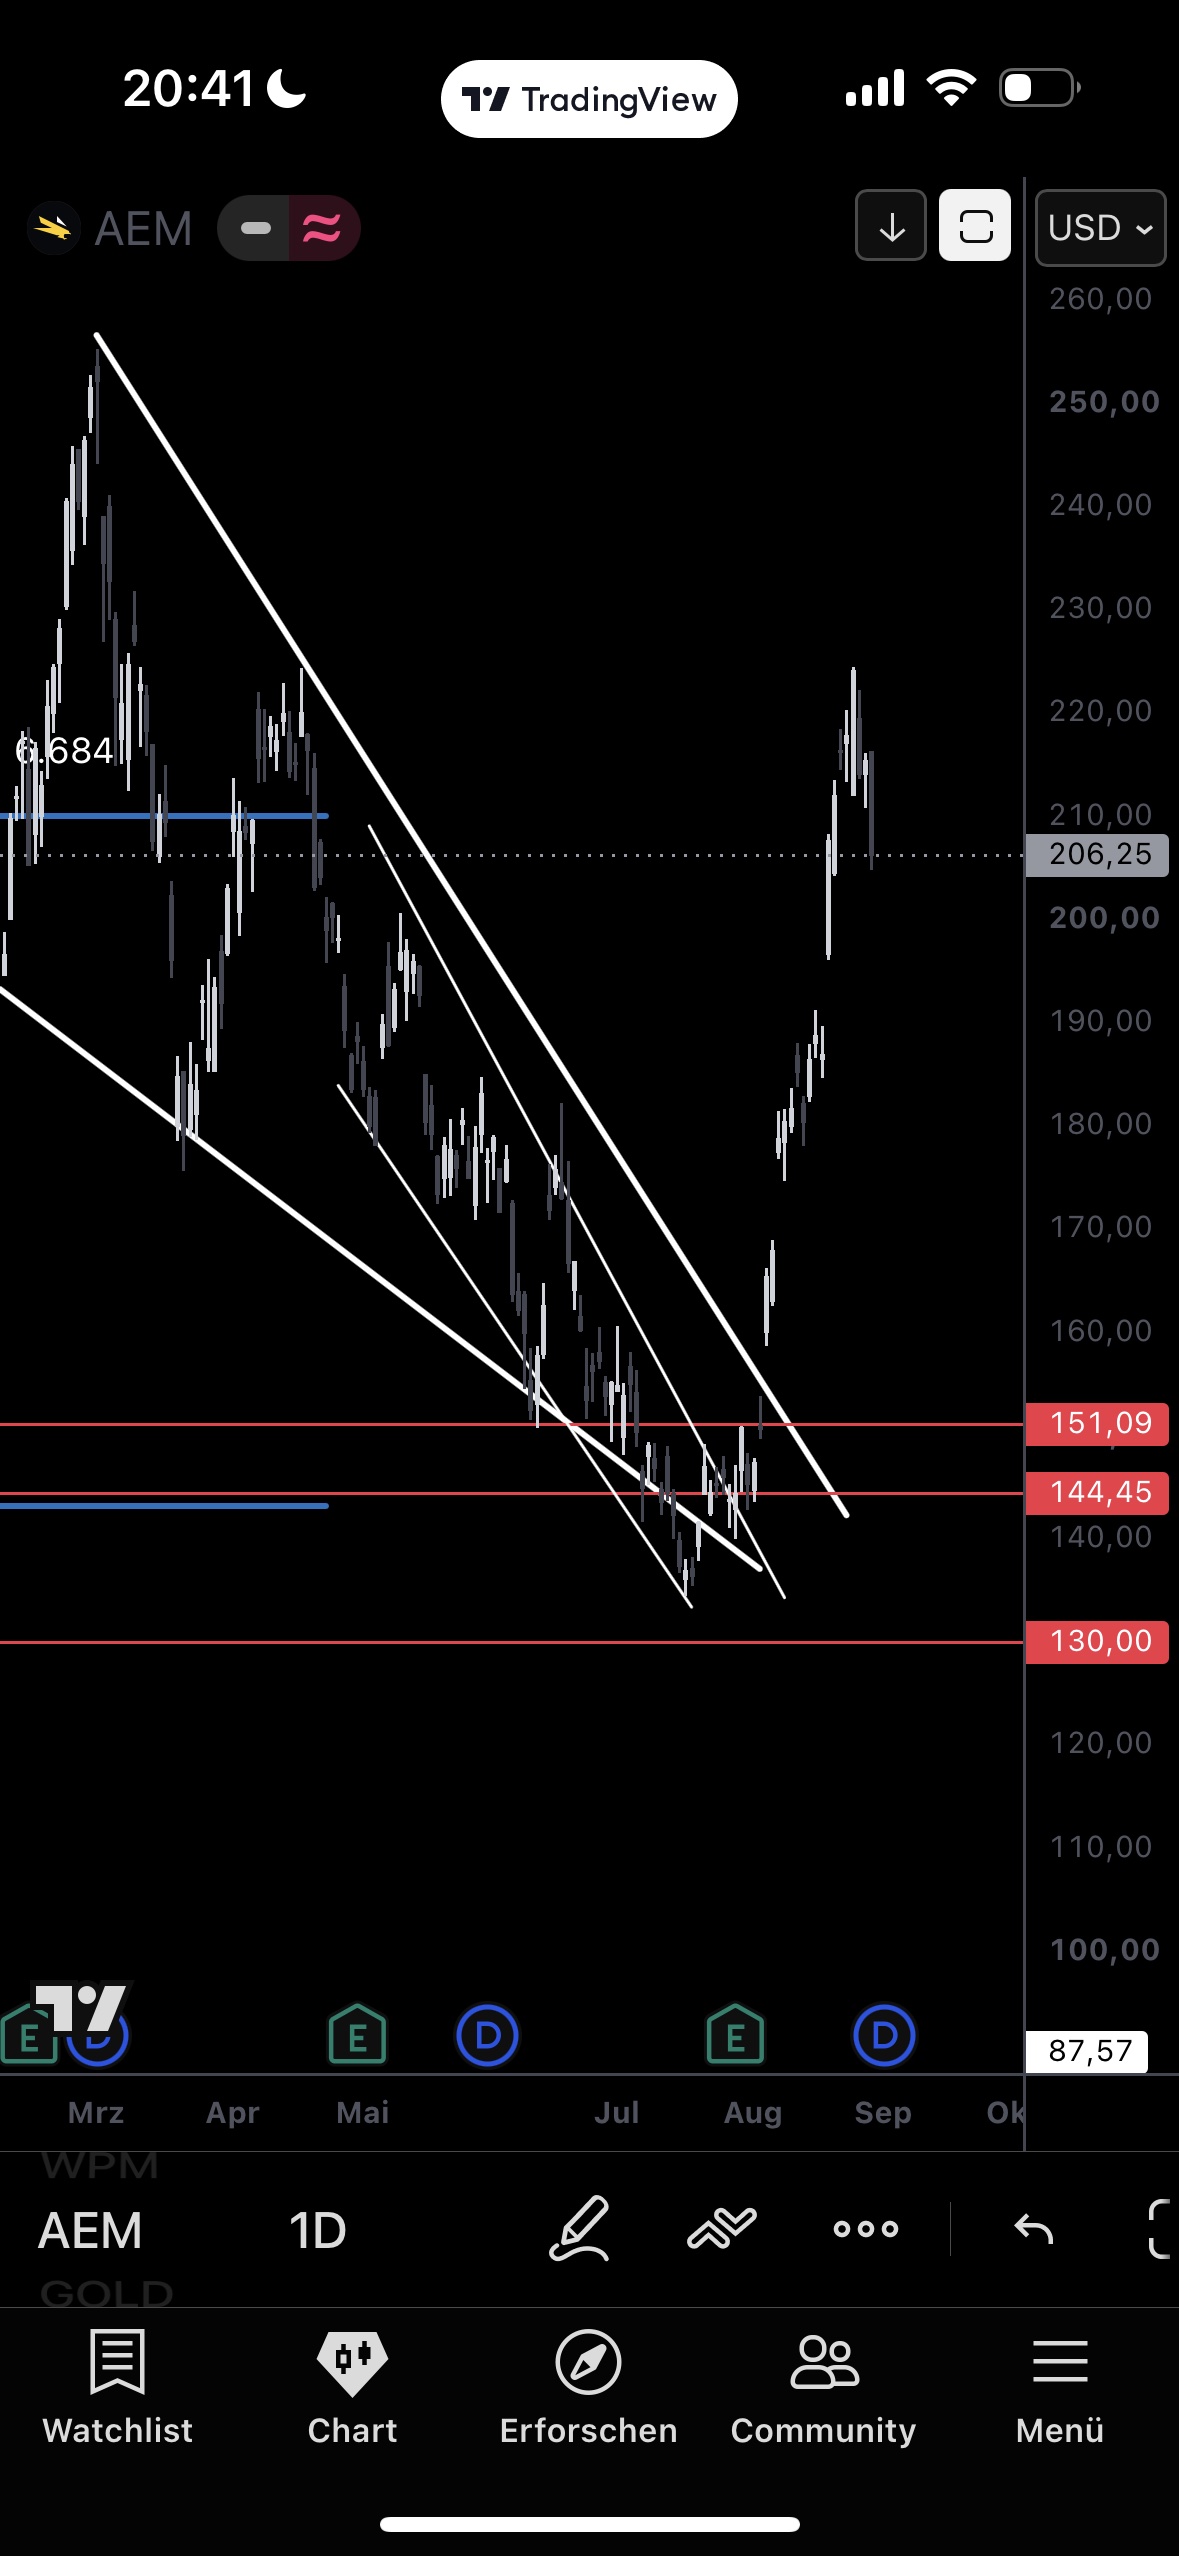
After a parabolic run to 224.62, the first serious pullback arrived: roughly 8% down to 206.25 — after +72% in about three weeks, at an old, repeatedly relevant level. Weekly structure intact, no confirmed bearish reversal candle. Holding 204.99–206.00 → continuation toward new highs. A break below opens the door toward 200.67.
Wheaton: blow-off, then consolidation.
1D
4H
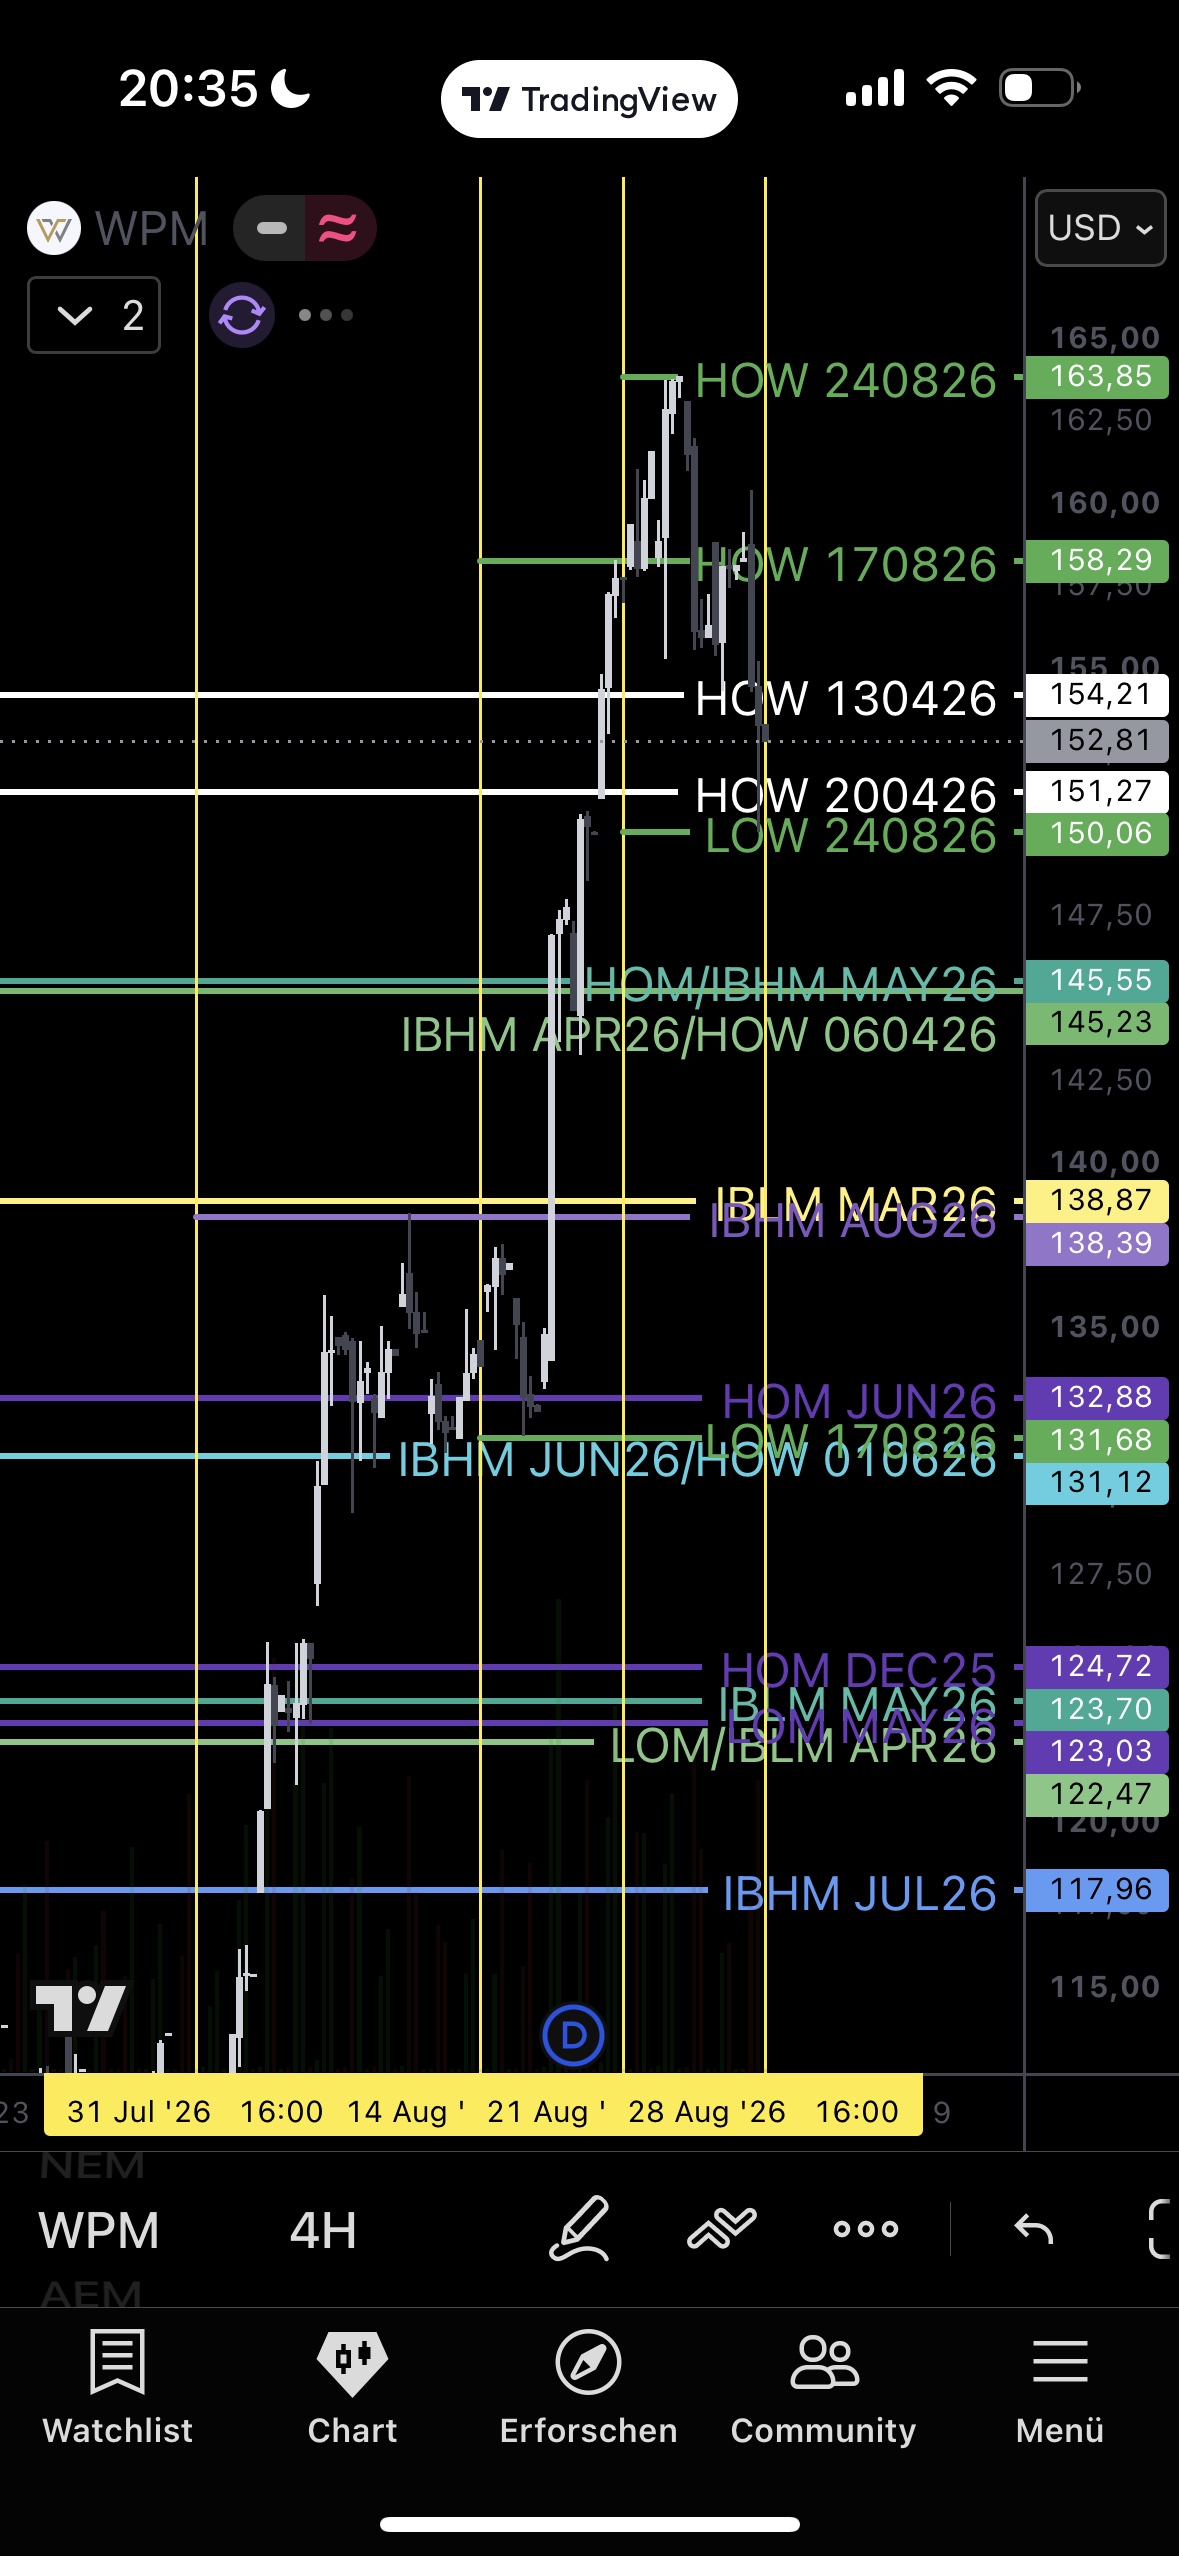
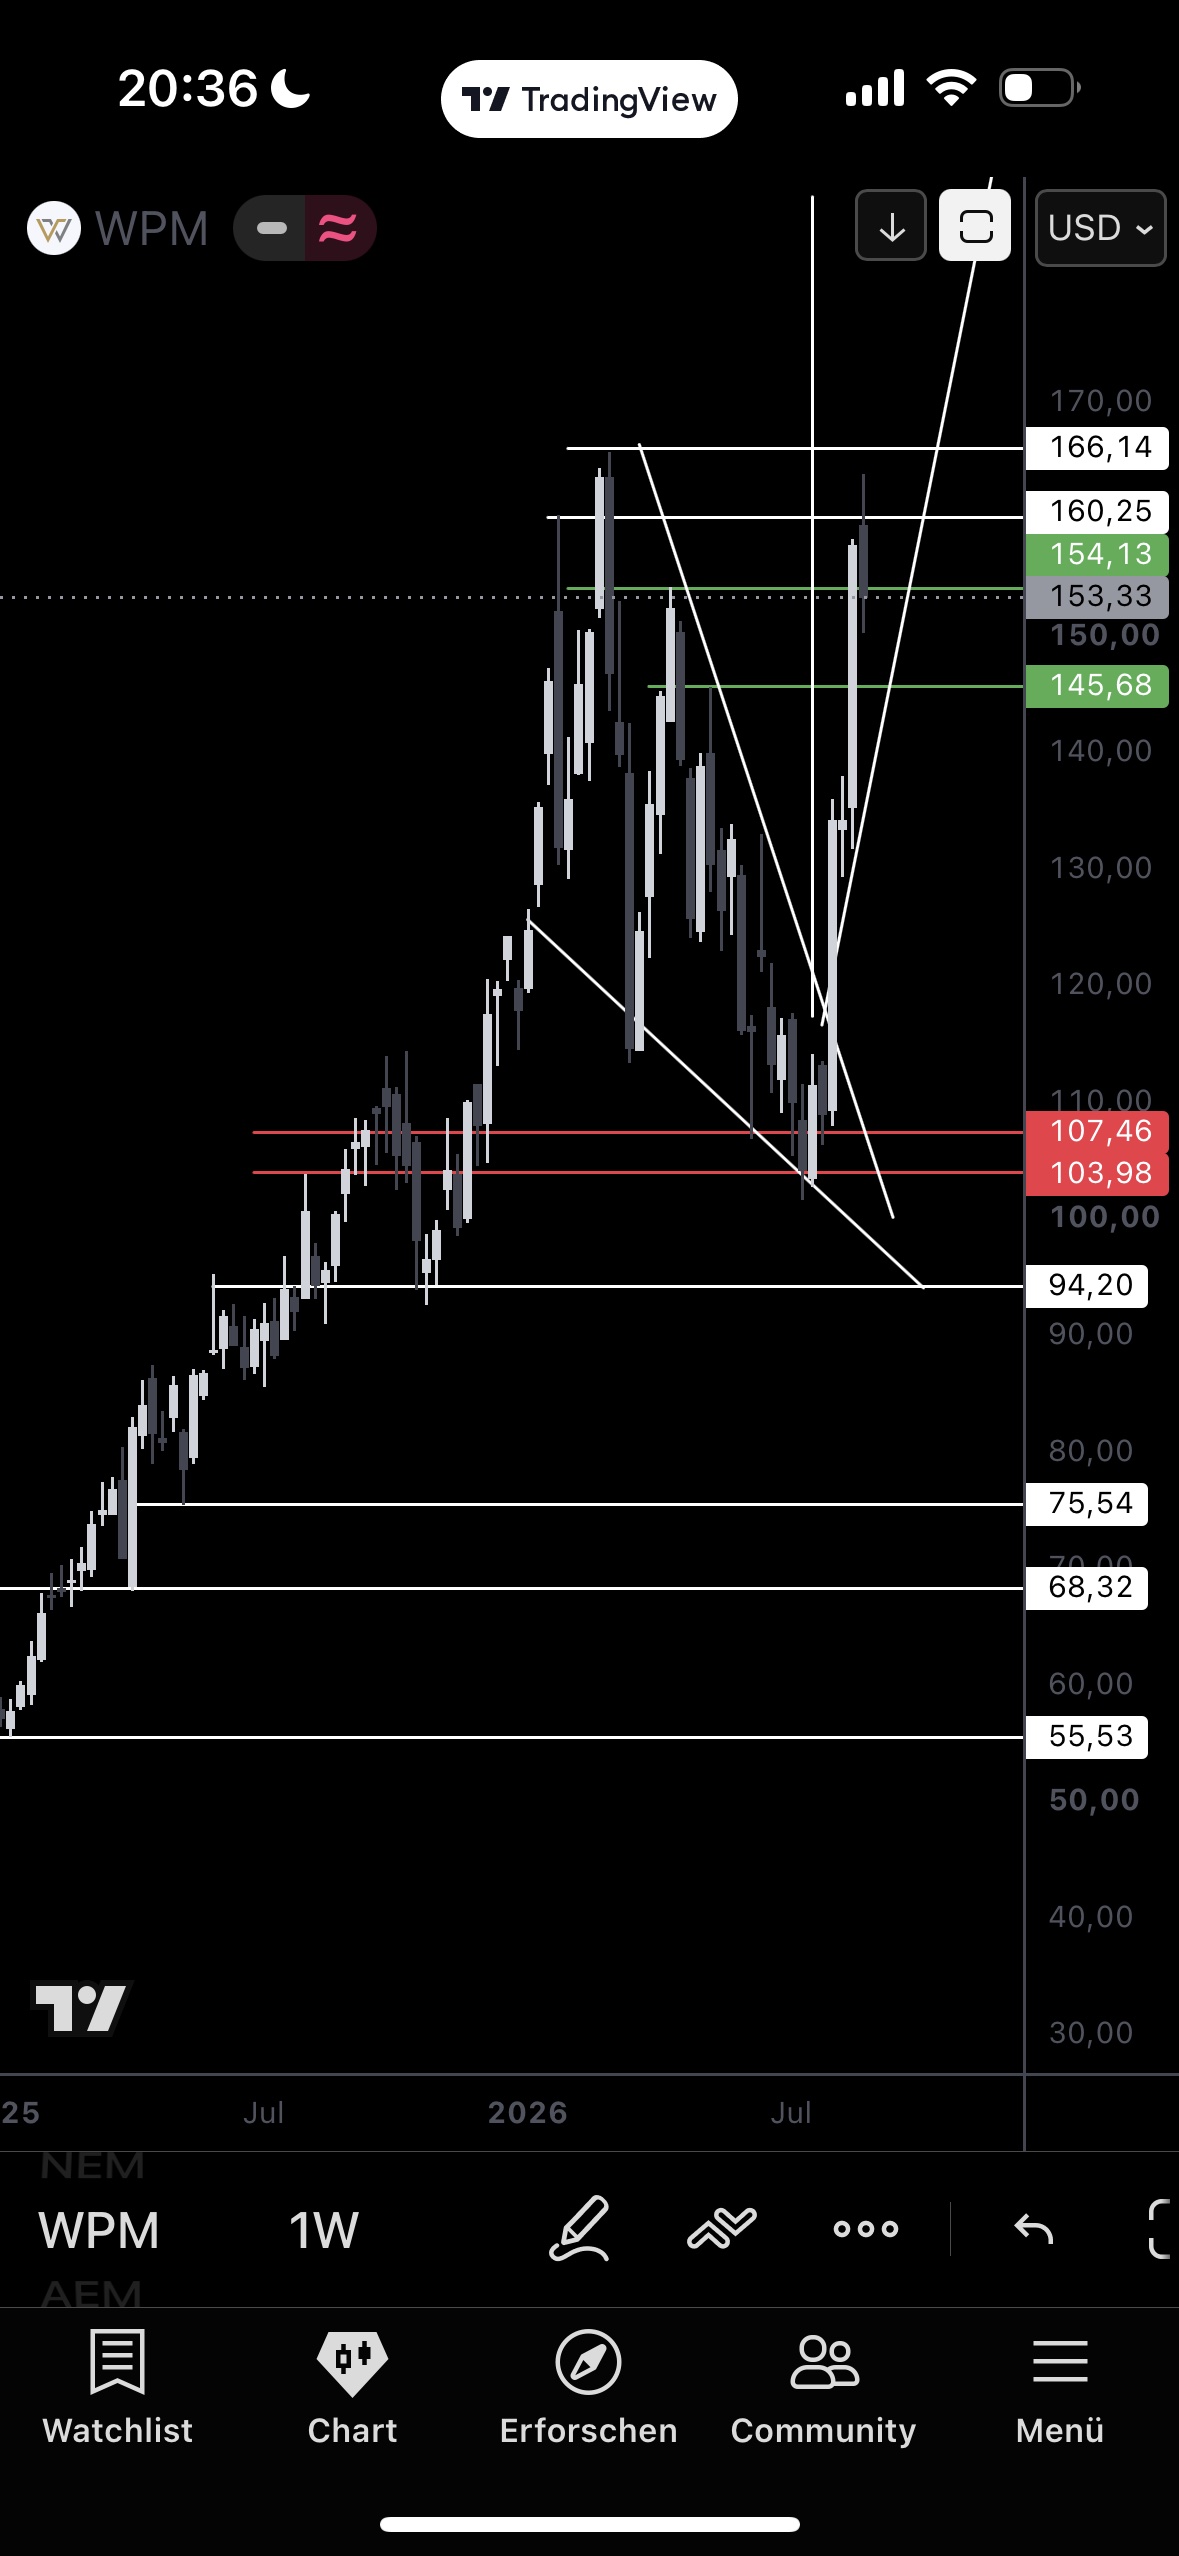
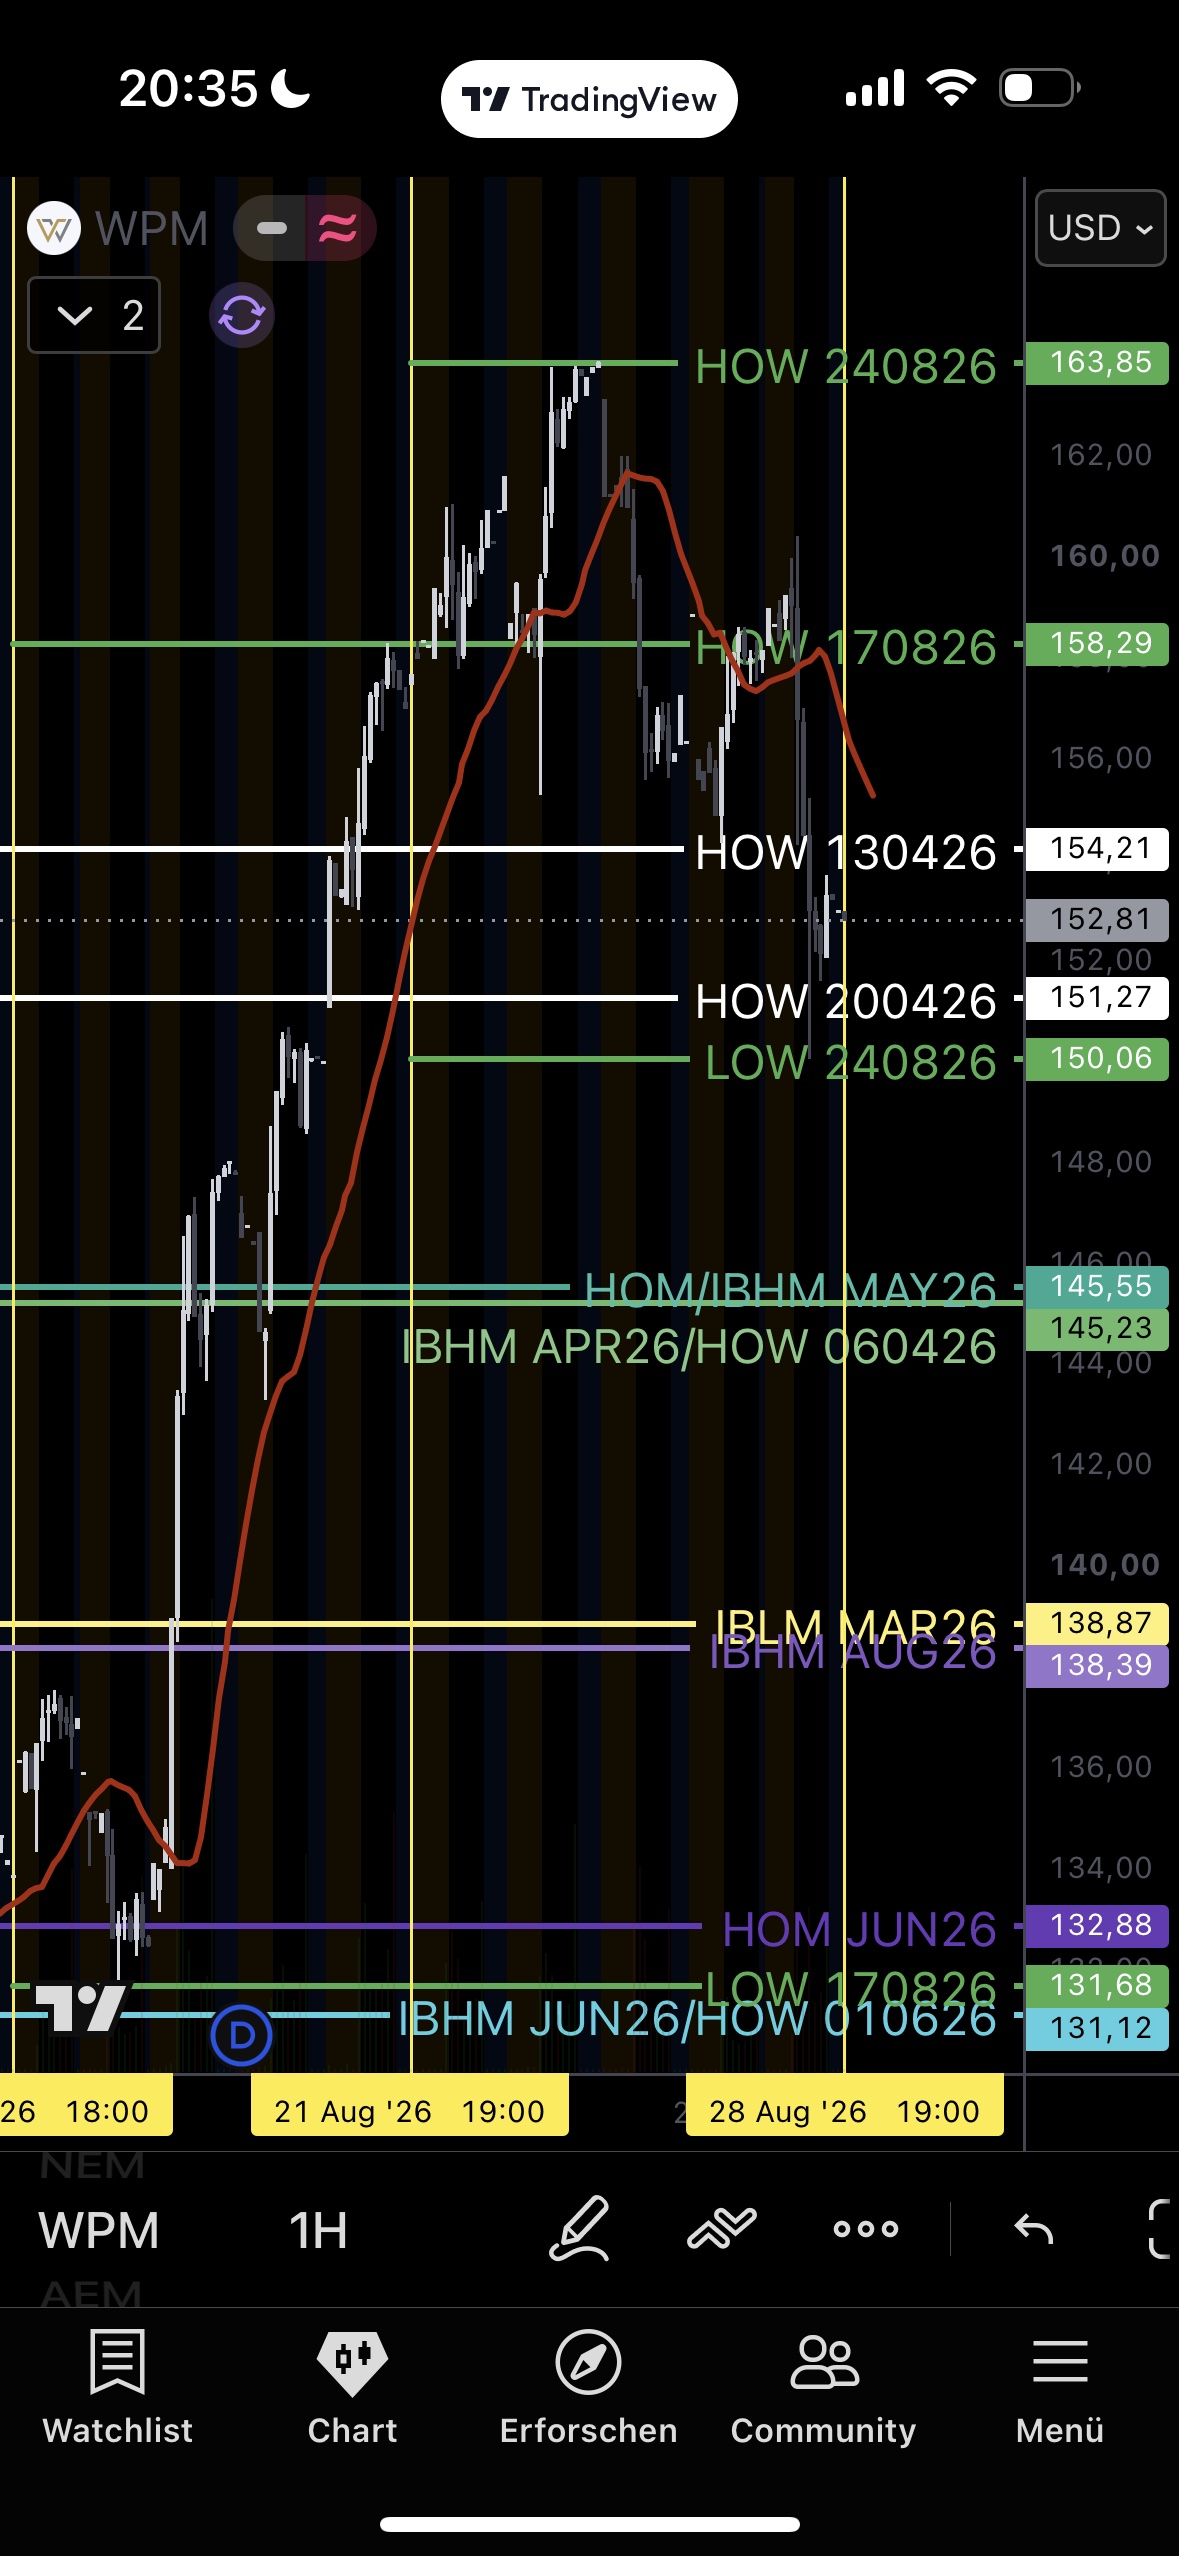
After last week's blow-off move (high 163.85 on Aug 24) comes a clear pullback — around $11 given back from the high, consolidating just above the 154.21/151.27 zone. No structural break — the pullback stays within the new, higher range. Bullish on a hold above 150.06/145.55 plus a reclaim of 154.21 → path toward 158.29 → 163.85 → 166.14 (ATH test).
Hecla: balance with rising value.
1D
4H
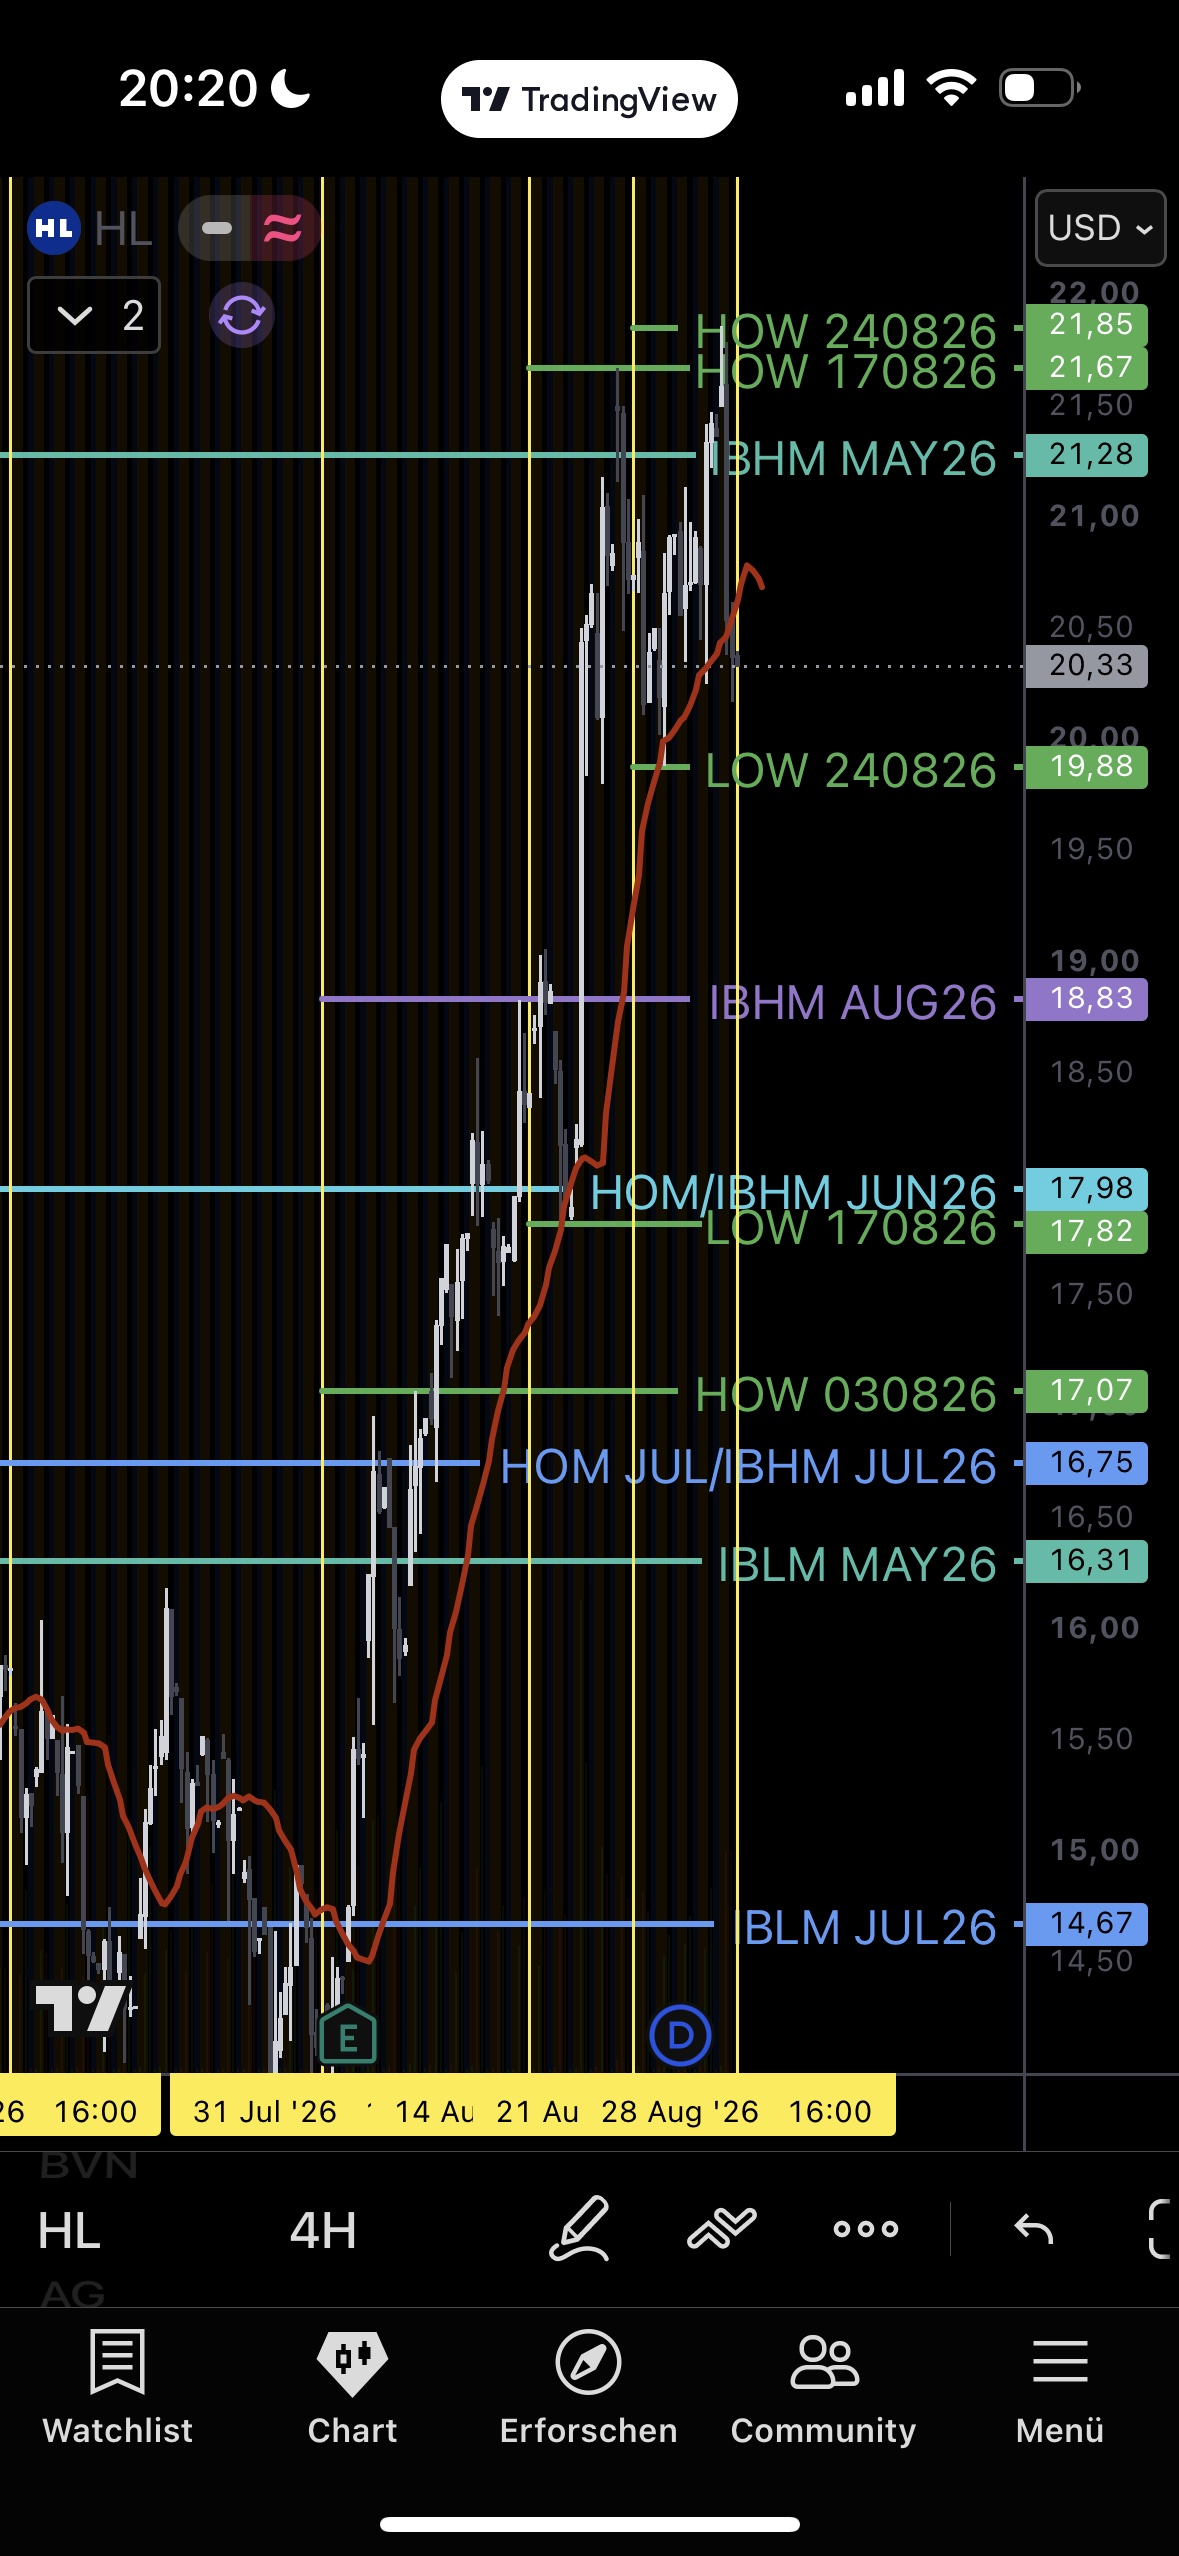
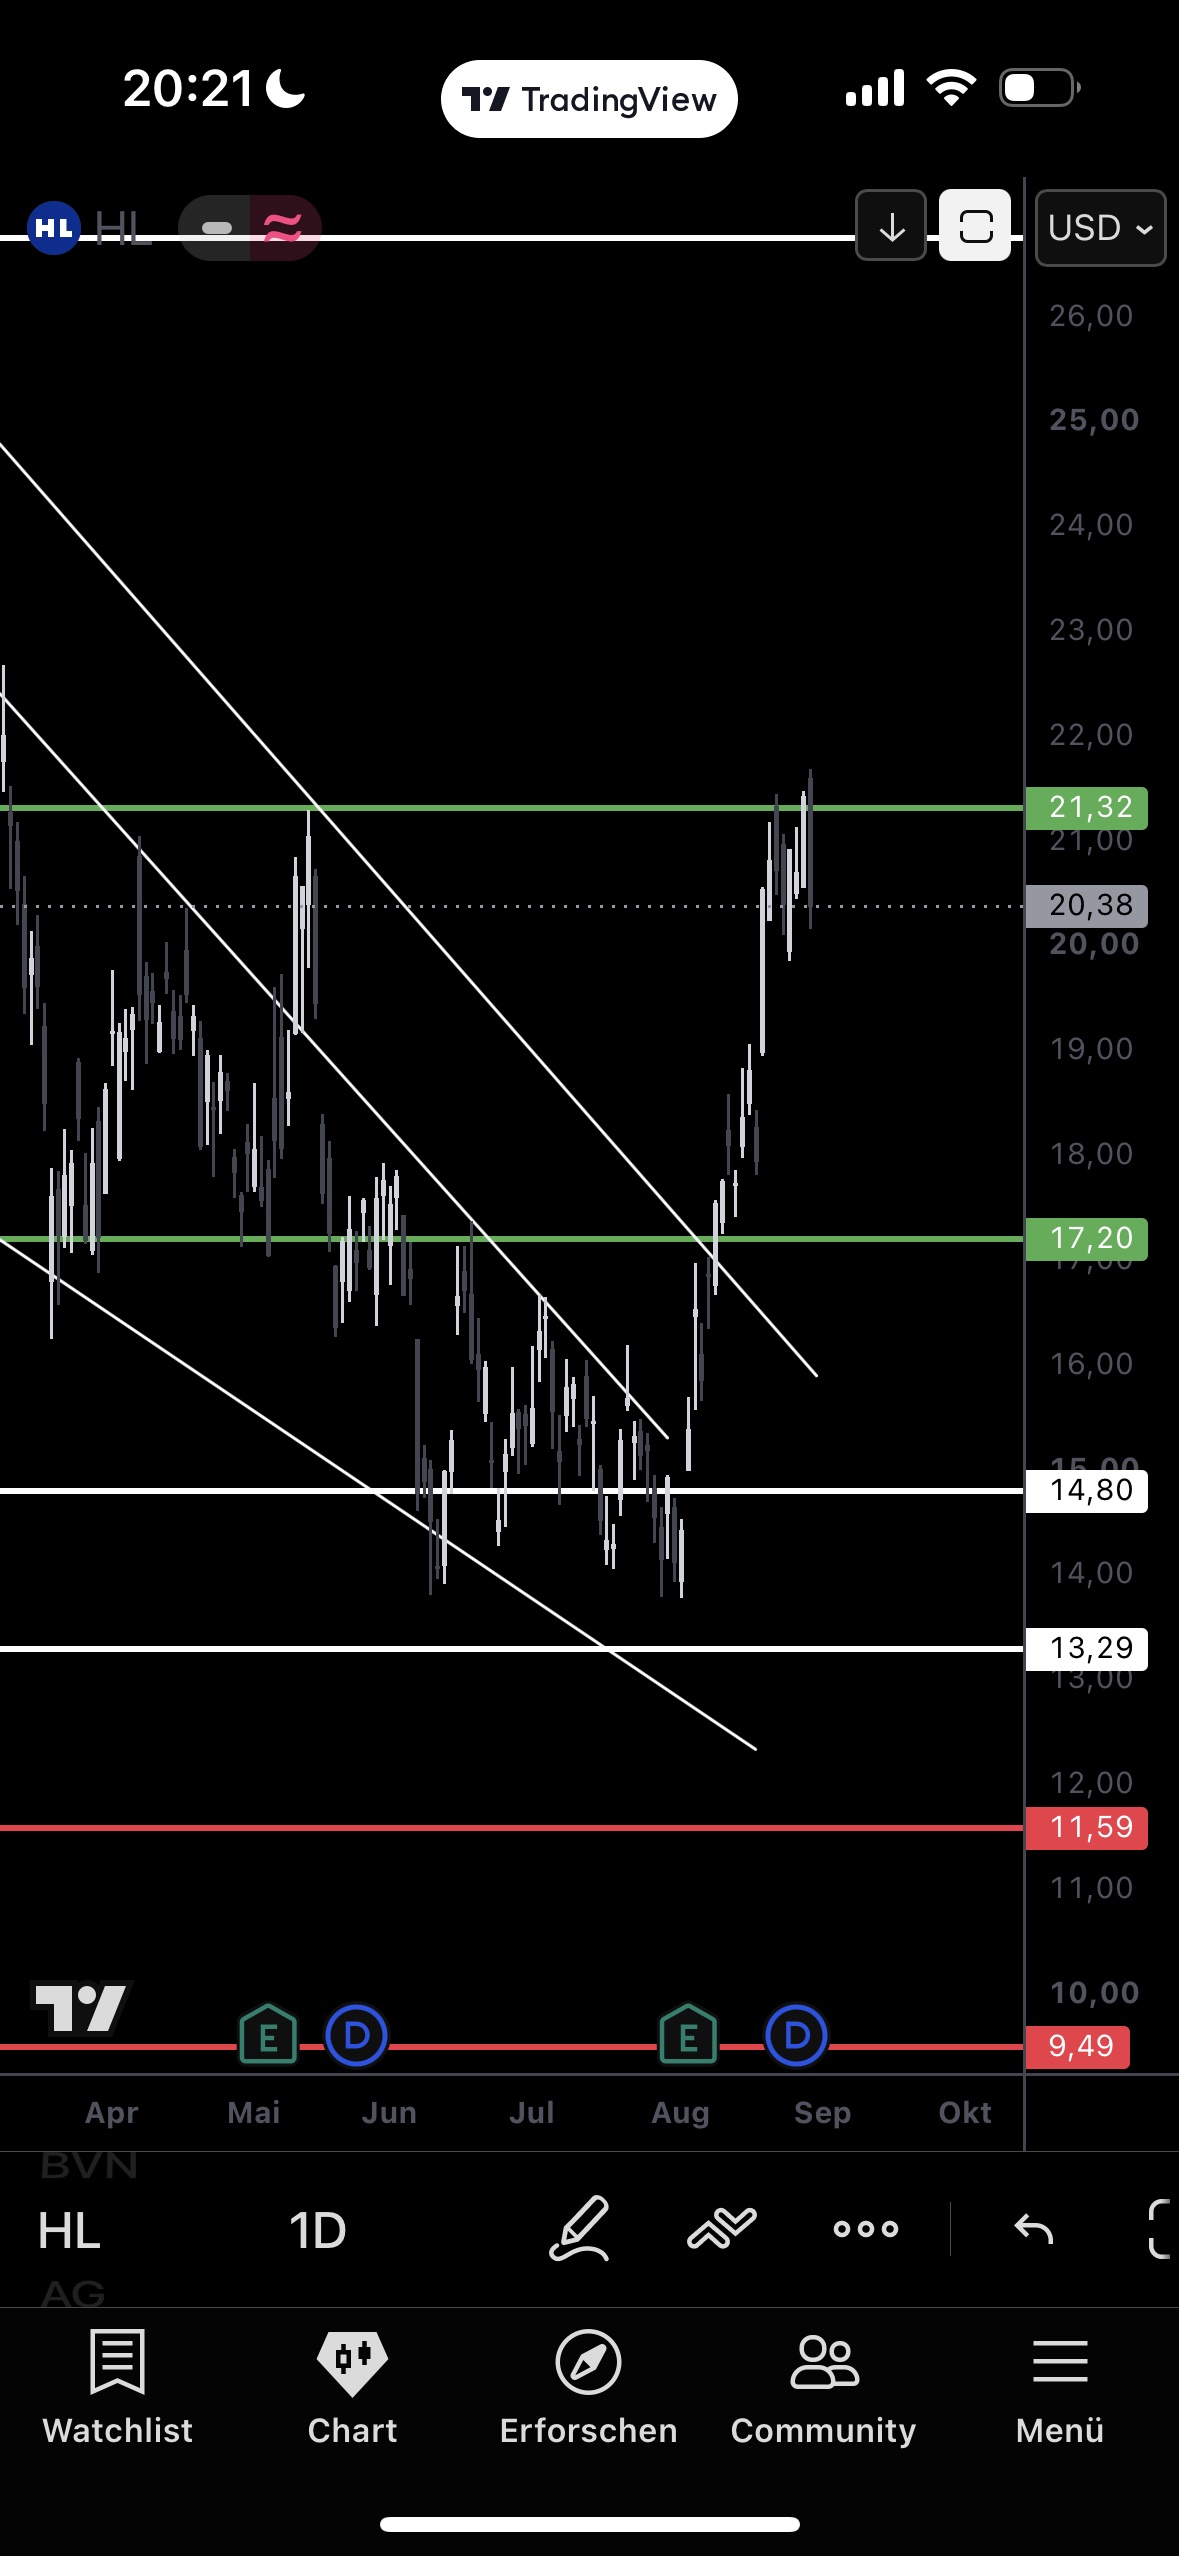
Price keeps rotating within the balance zone, but with an important structural shift: a new high at 21.85 (above the prior 21.67), lows clearly rising (17.82 → 19.88). That's balance with rising value rather than pure sideways action — a classic sign of absorption at the top before a possible breakout. Trigger: weekly close >21.32 for continuation, warning sign on a weekly close <17.98/17.82.
Fresnillo: testing the macro trendline.
1D
4H
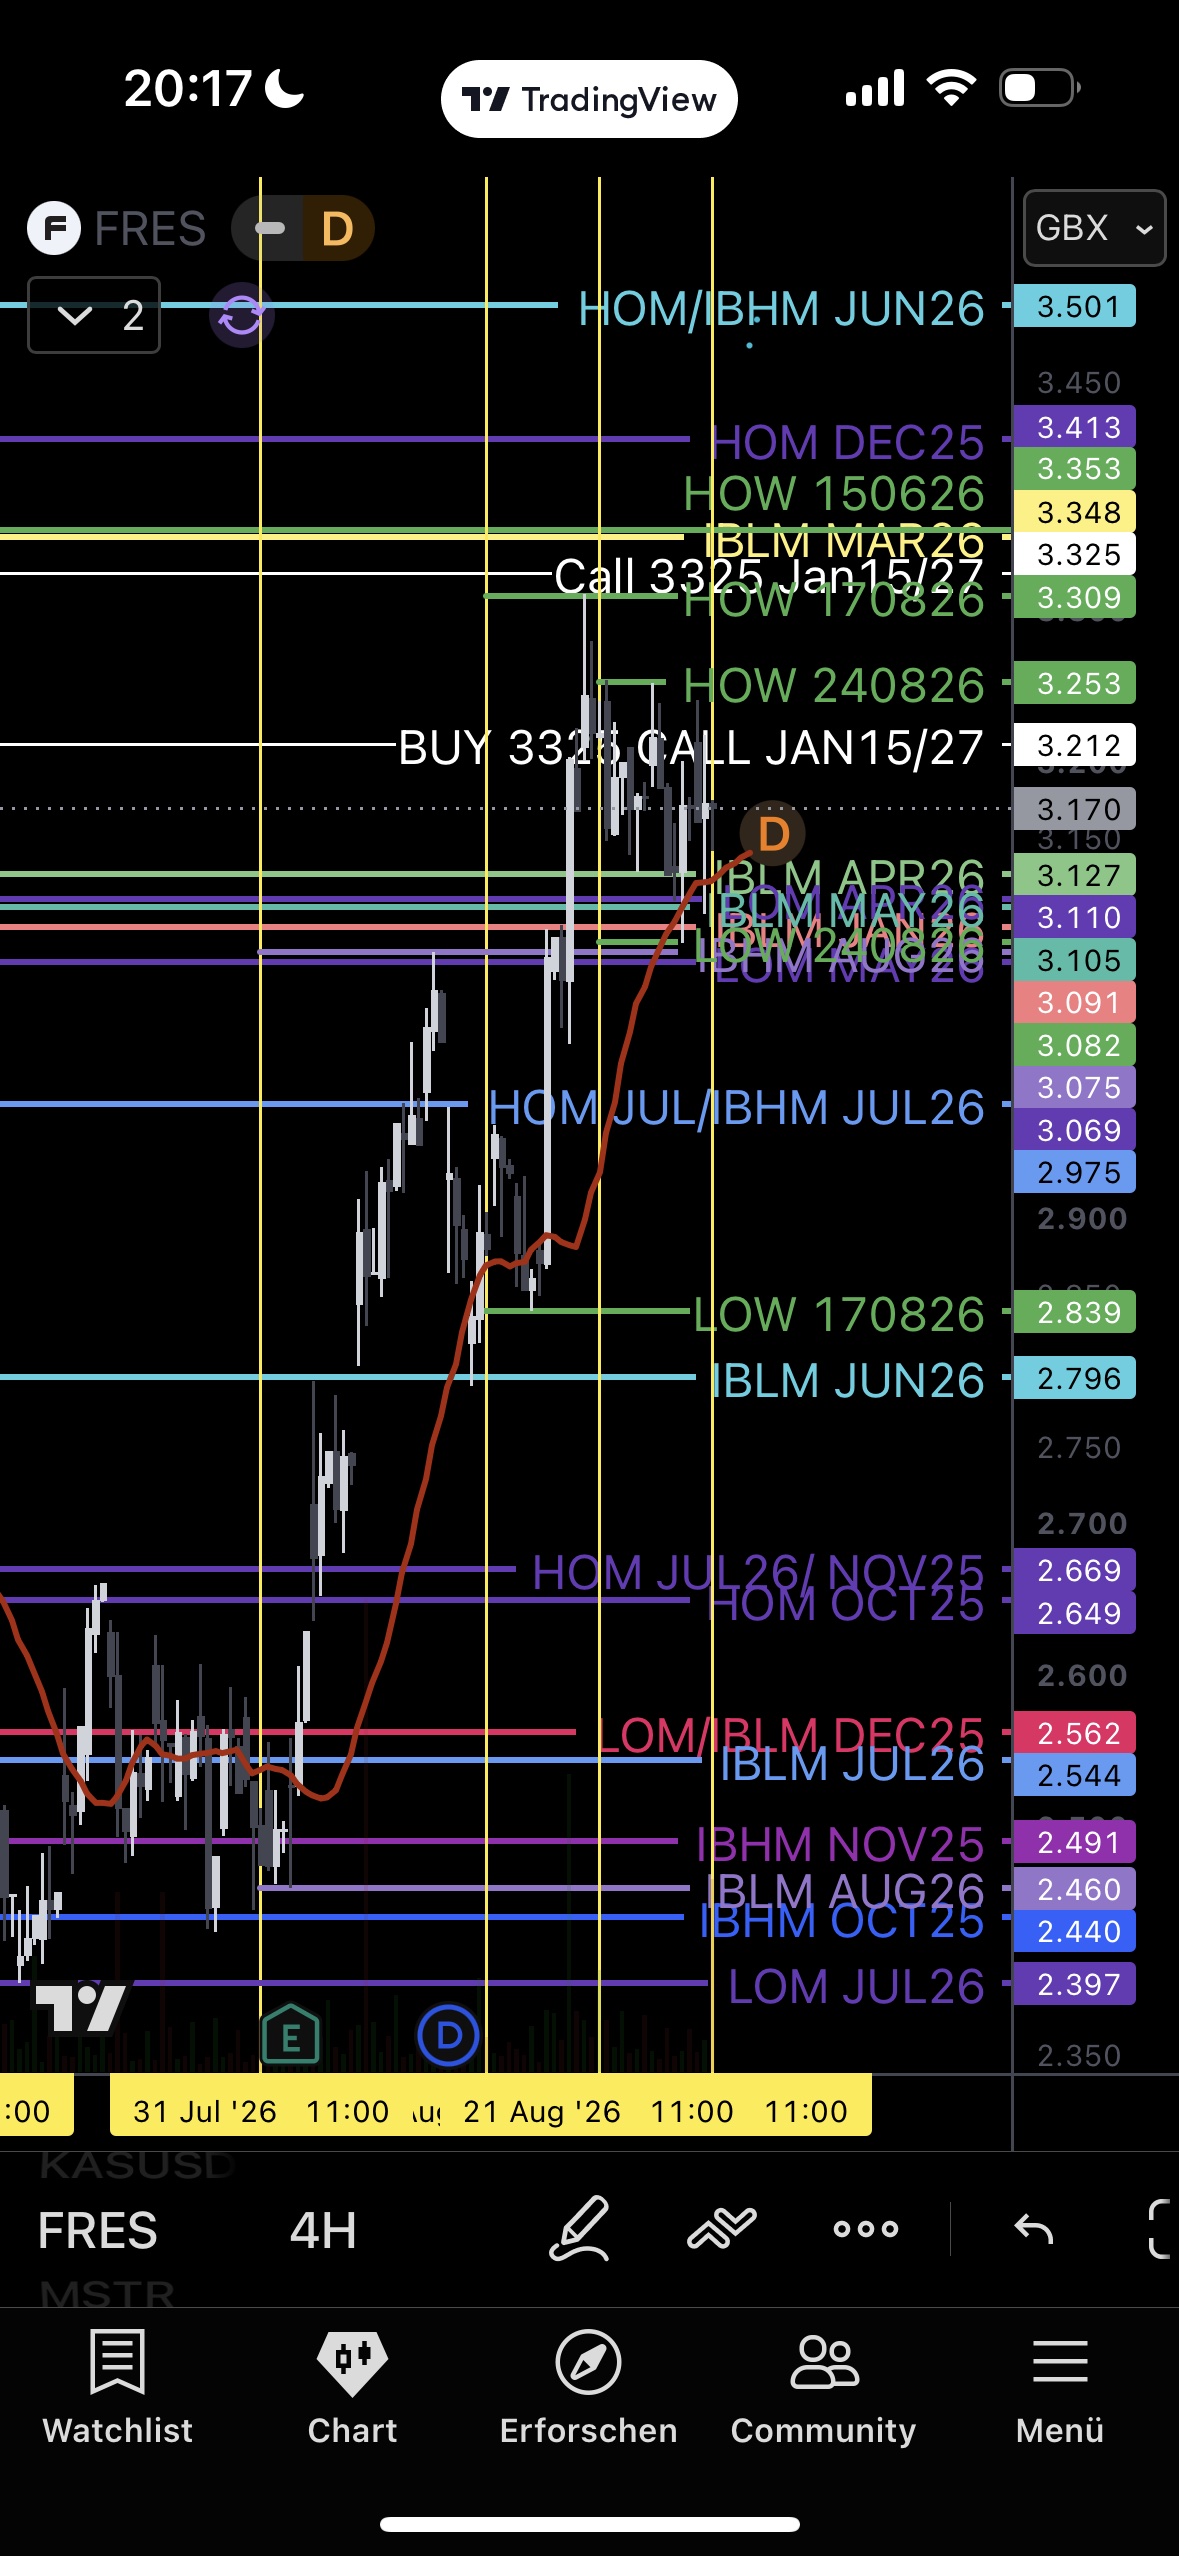
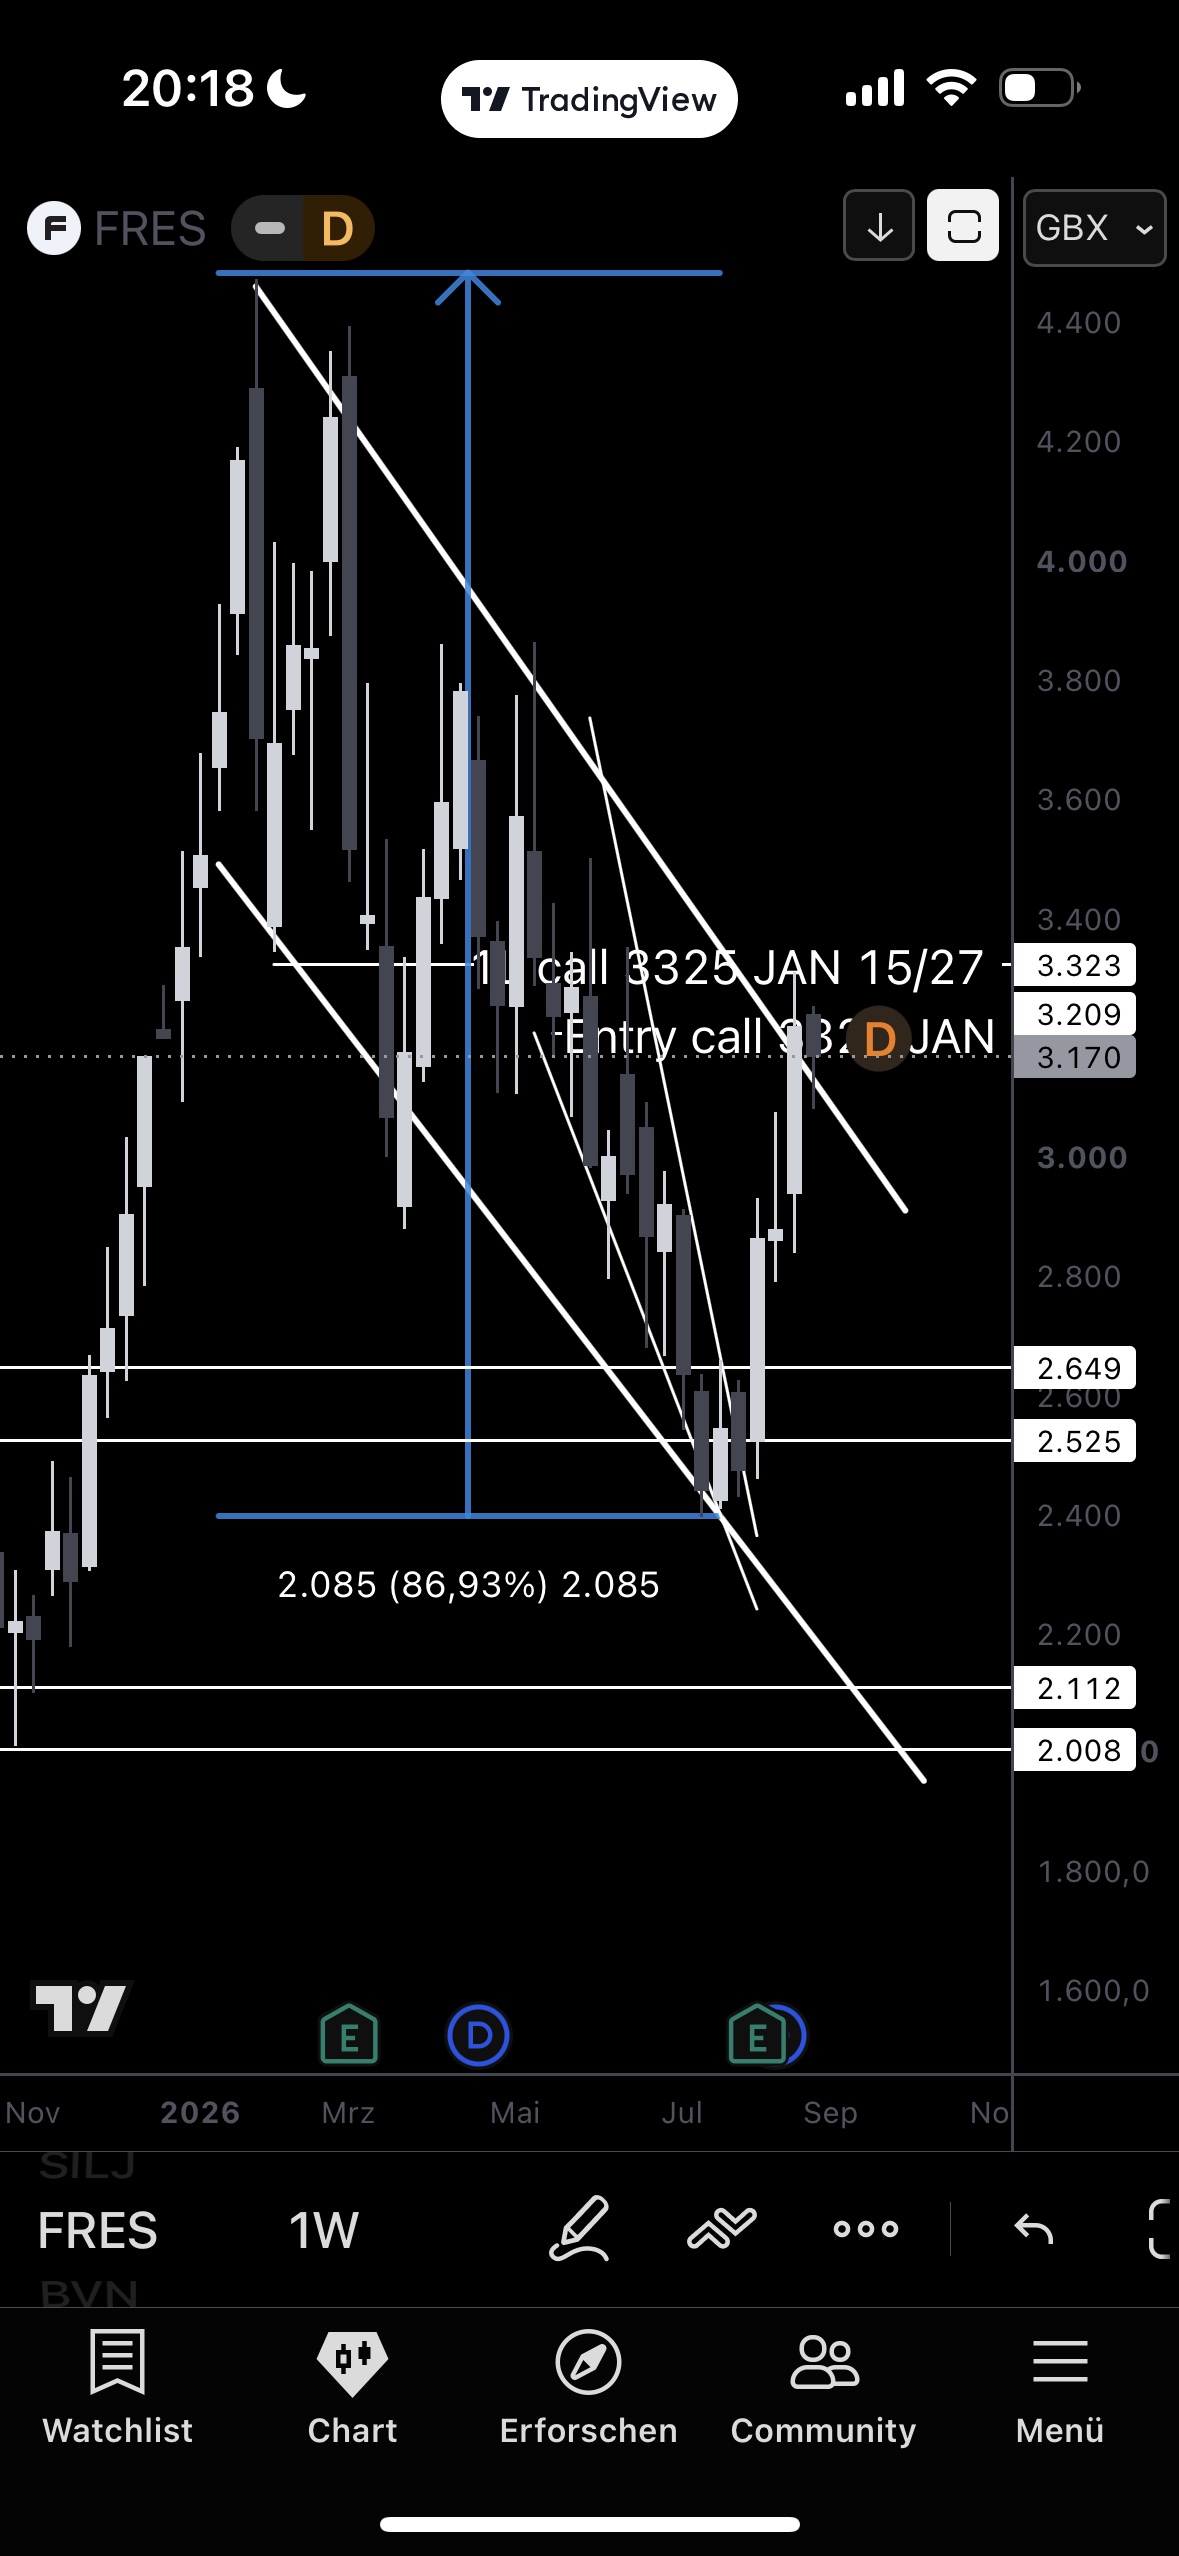
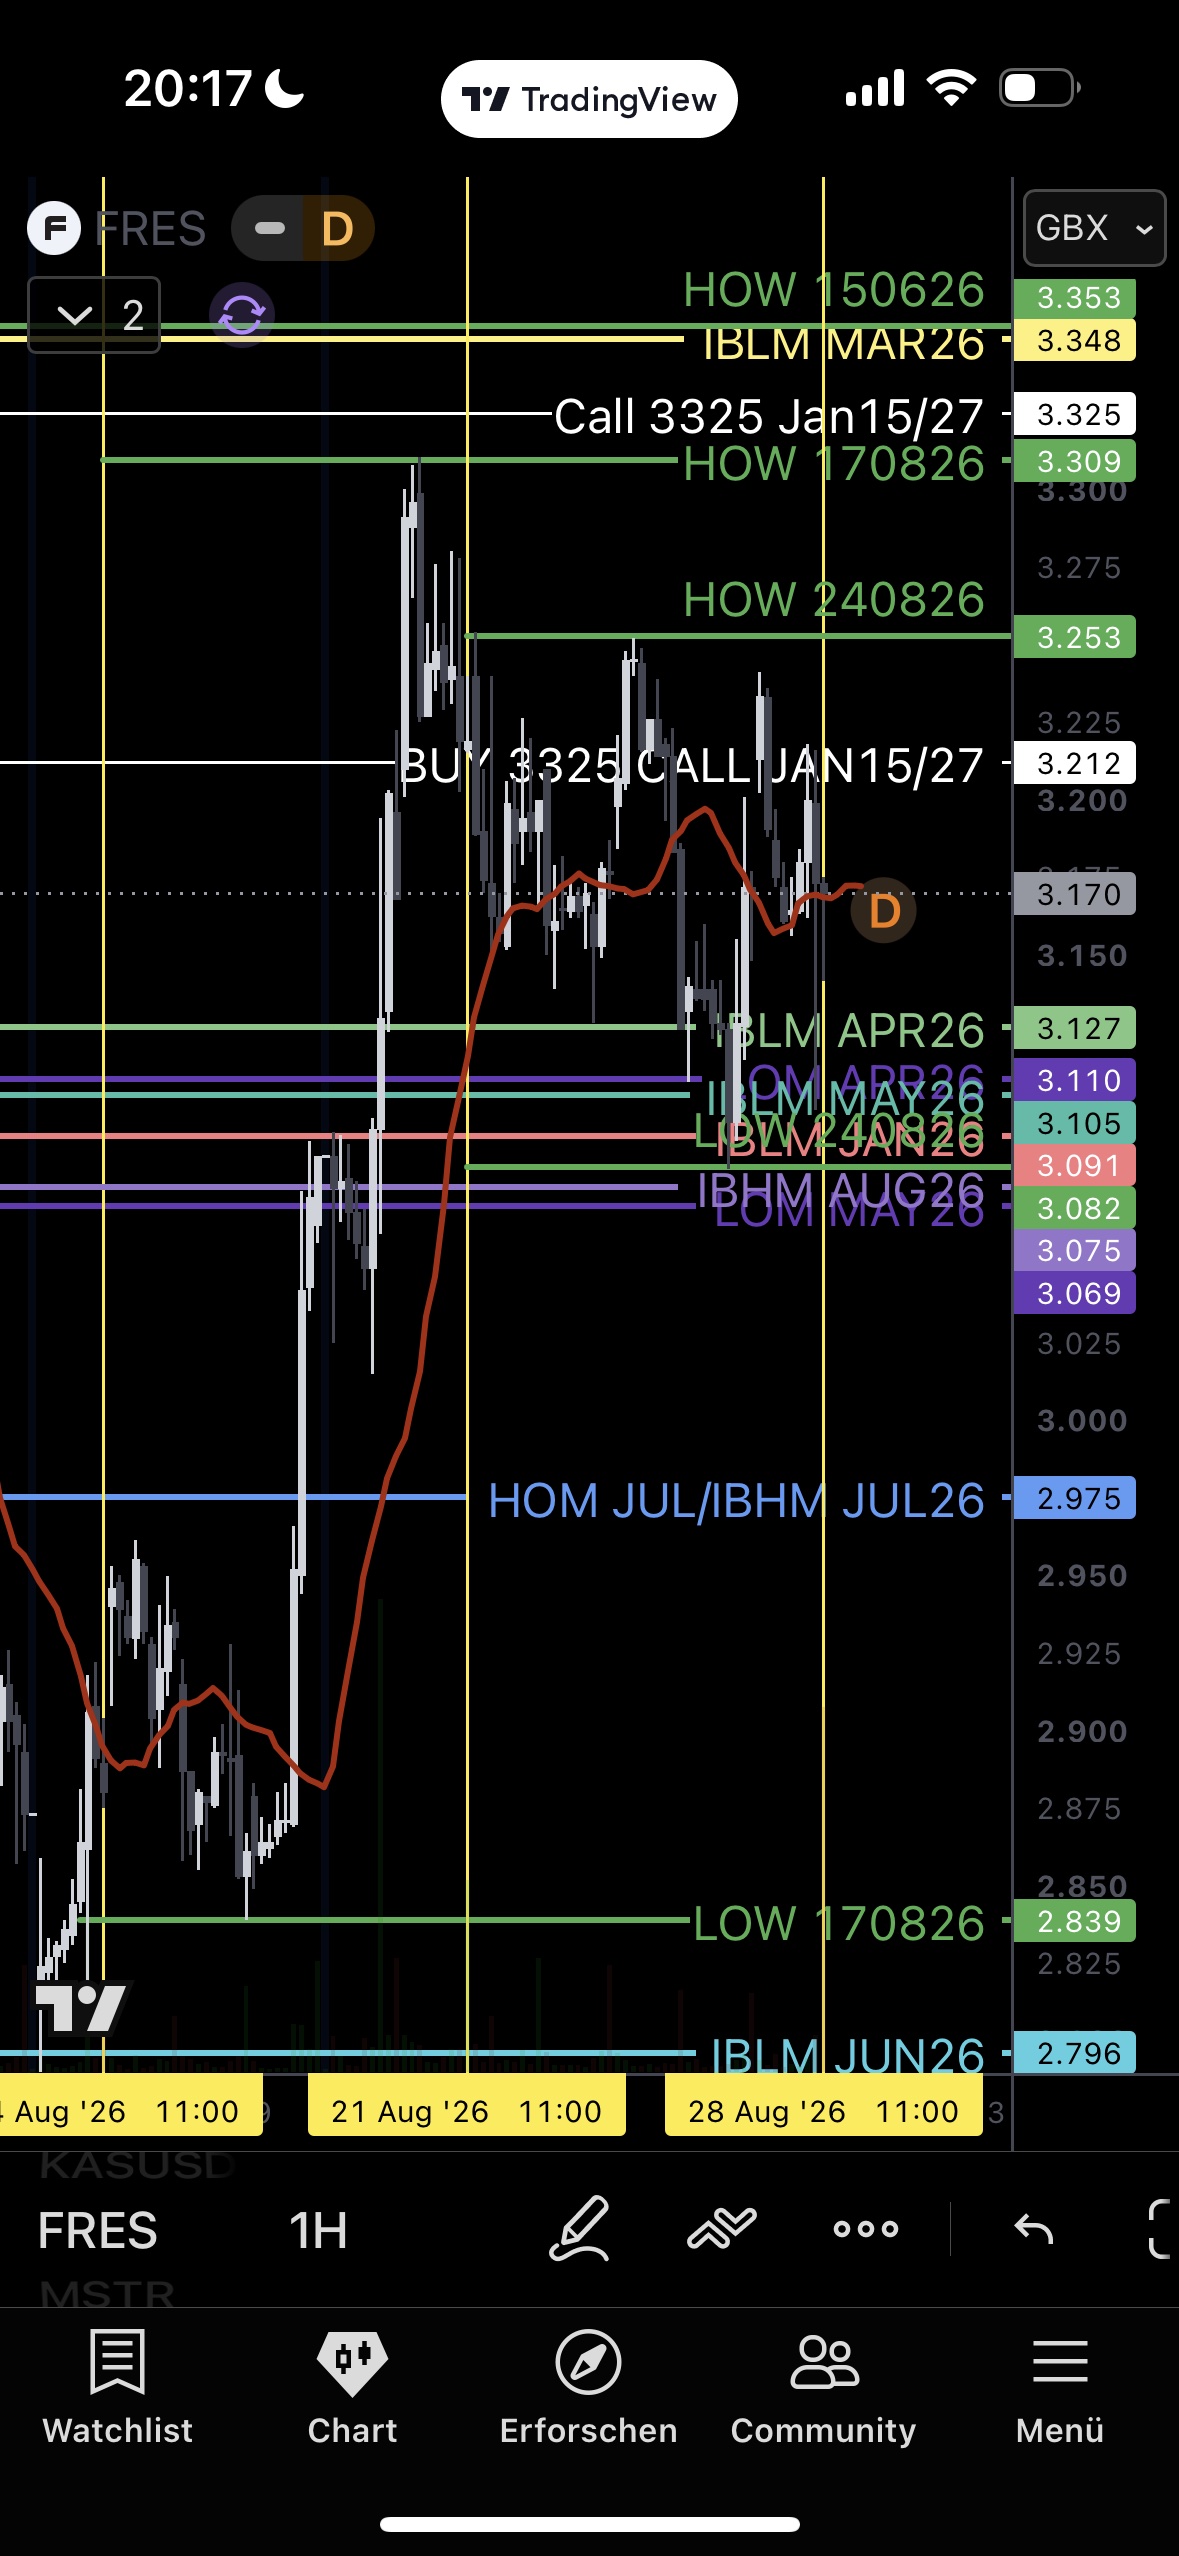
Price is testing the outer falling trendline of the macro wedge since the January 2026 ATH — a first touch/slight push through on the daily. After the vertical move via the Treasury buyback catalyst (Aug 19) to a high of 3,253, consolidation is underway. Bullish on a close above 3,253 → strike test 3,325. Warning sign on a drop below 3,069 → pullback toward 2,975. Despite the rally off the low, this remains the second-largest loss position — a high cost basis/theta explains the gap to the price action.
Gold.com: trigger hit, clean pullback.
1D
4H
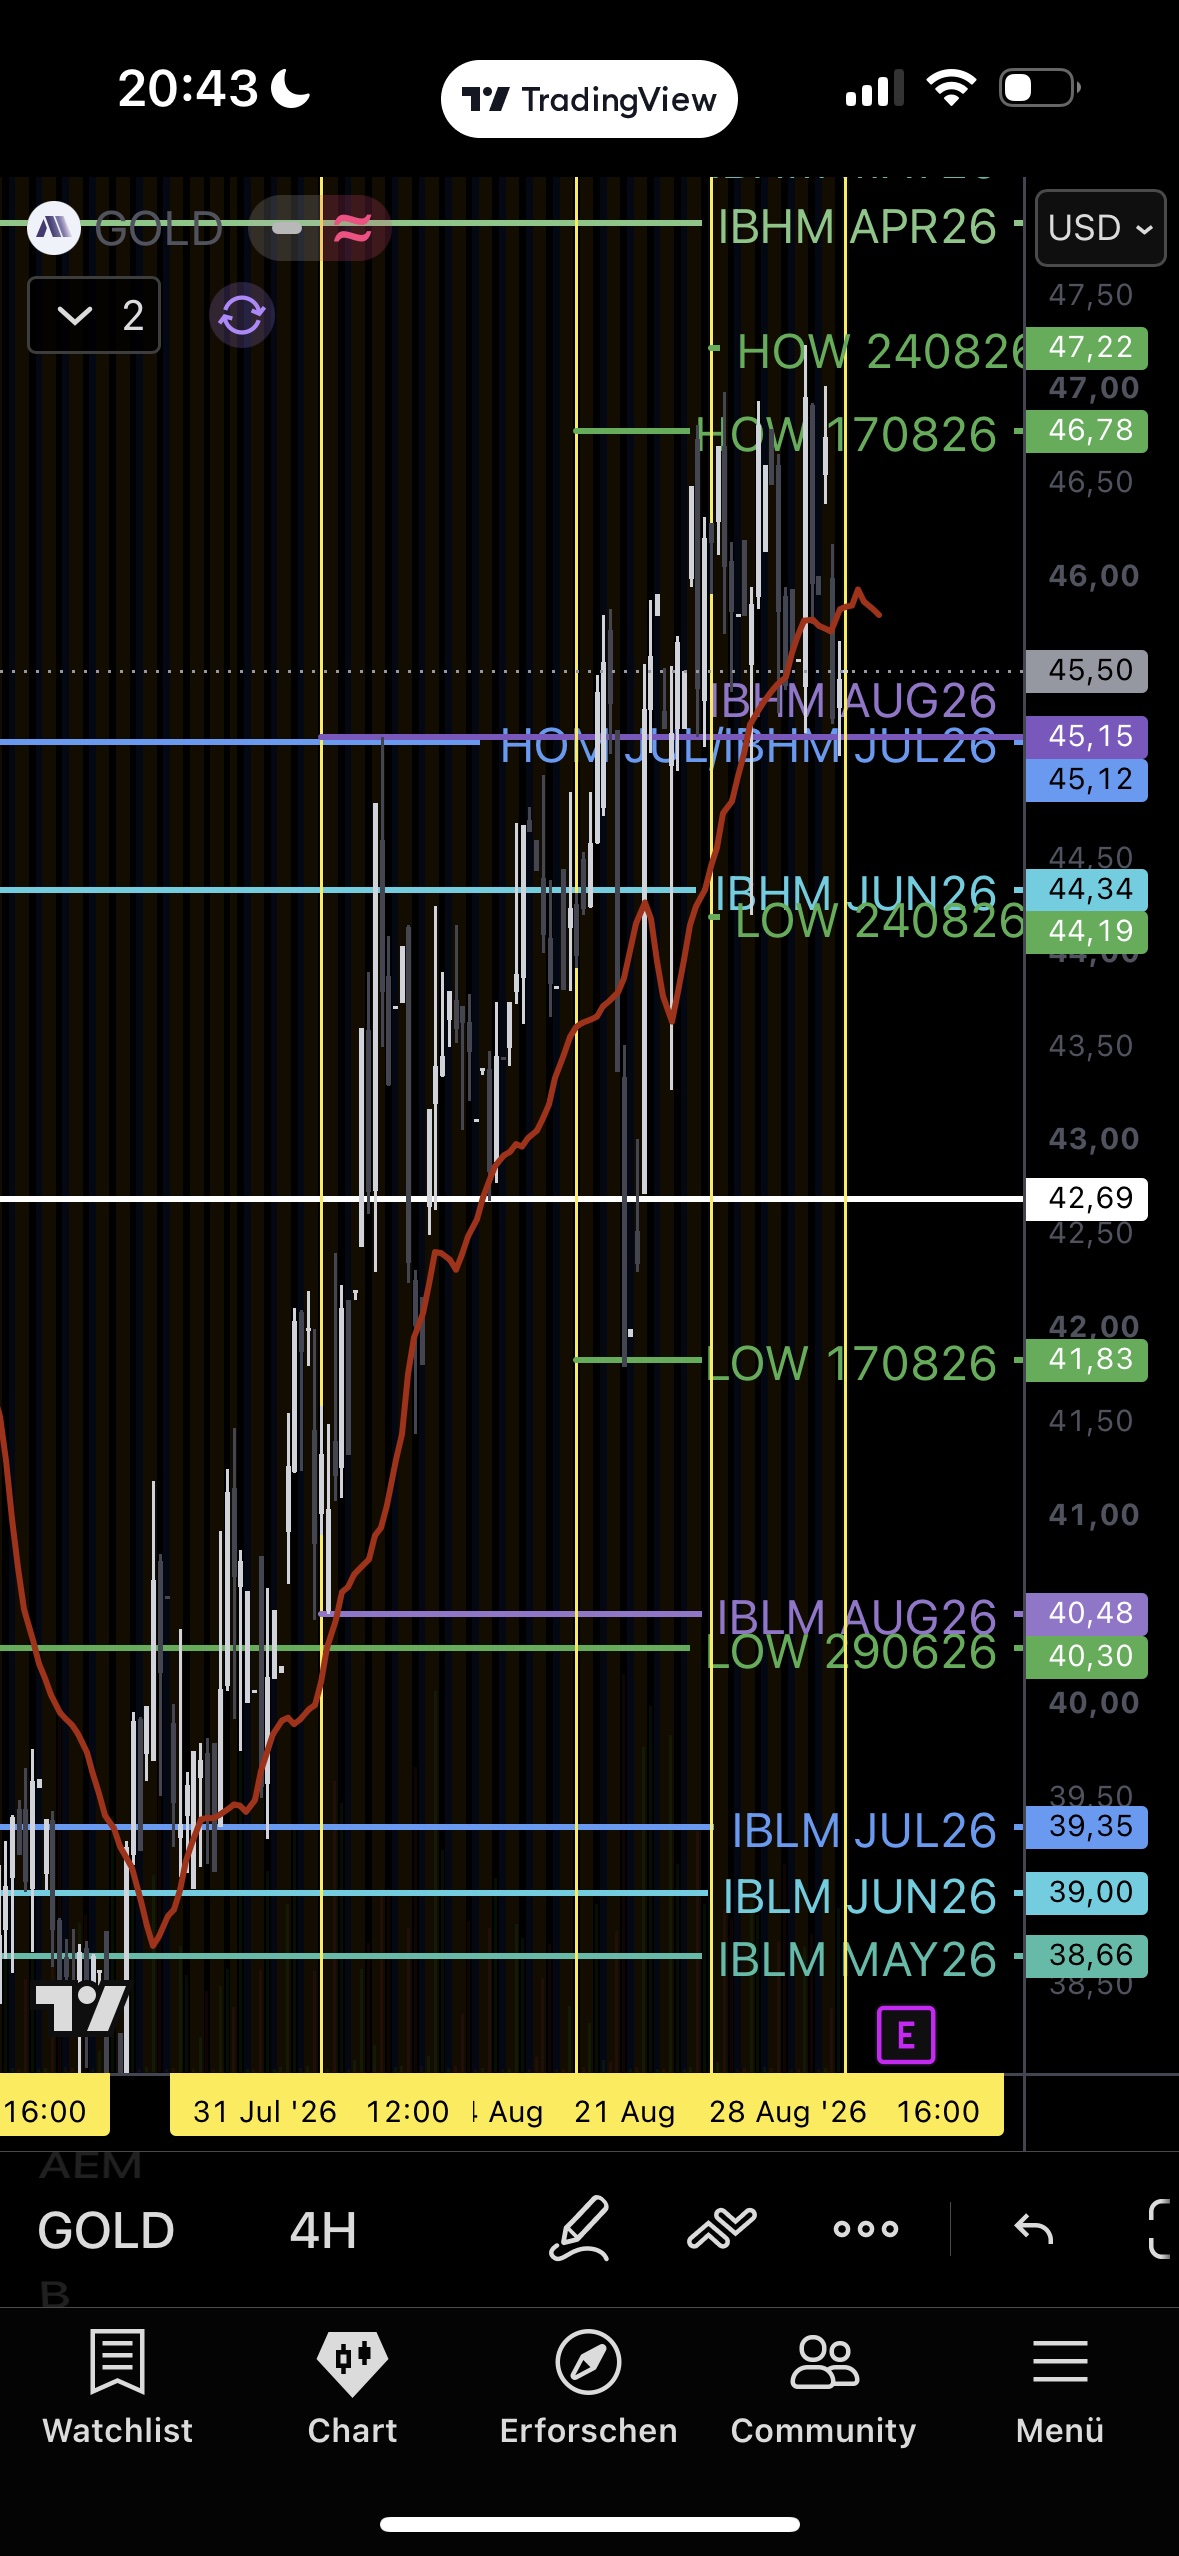
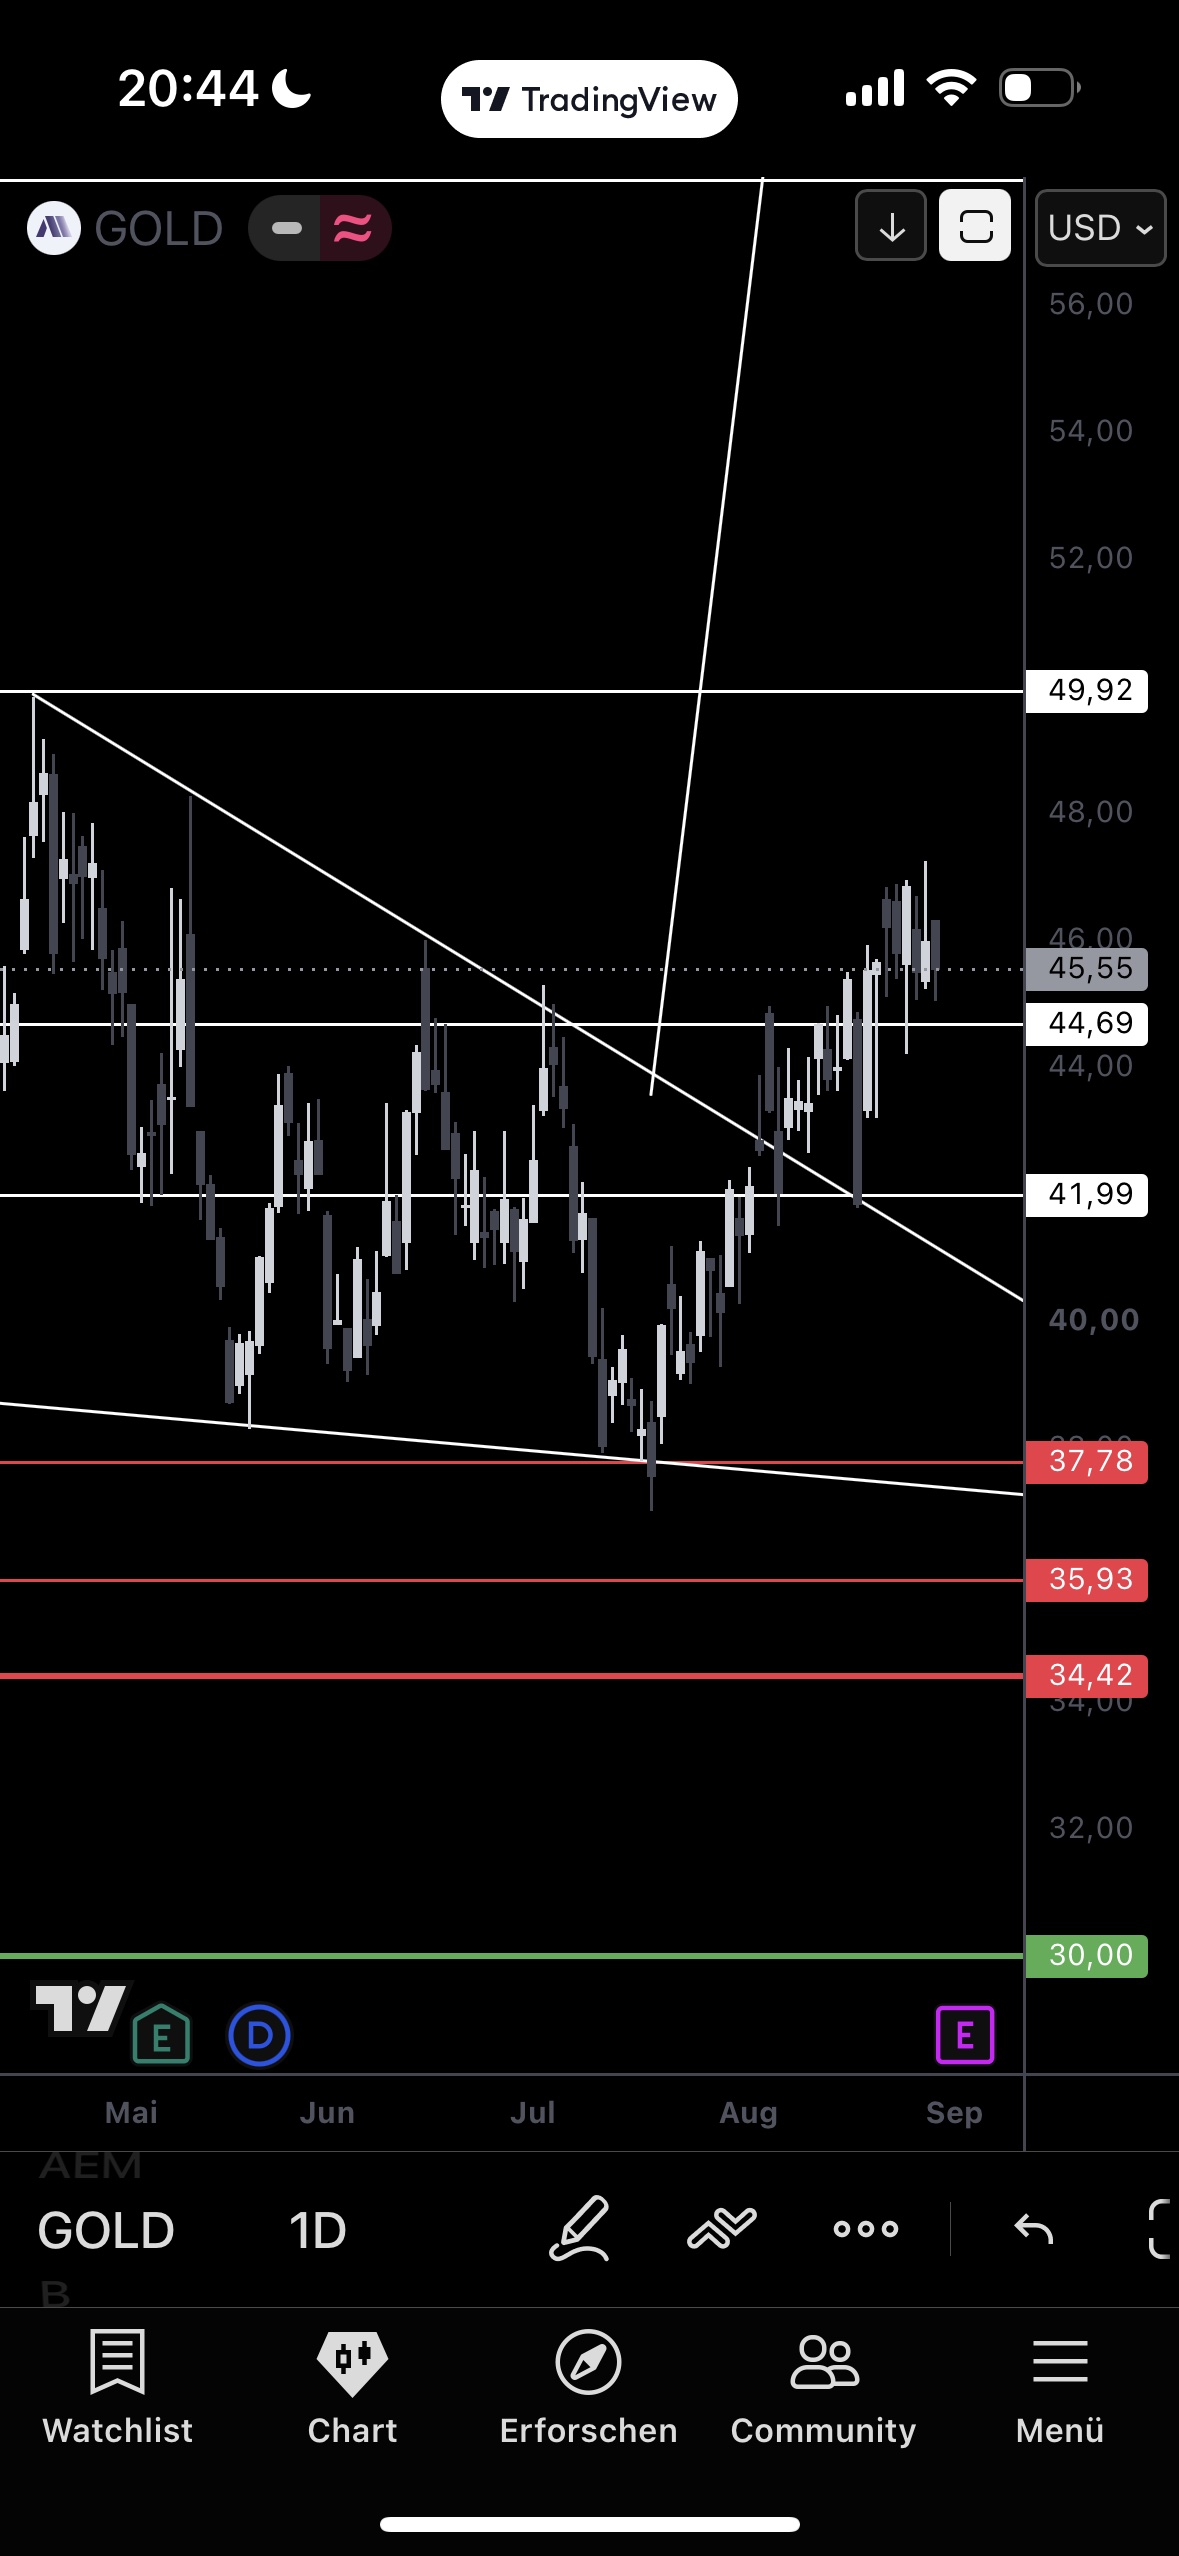
A new weekly high at 47.22 was reached — clearly overtaking the prior update's 46.78, so the trigger is confirmed. Price has since consolidated back to 45.55 without breaking the 45.12–45.15 support. Structure intact — higher highs, higher lows since the weekly breakout from the falling wedge. The consolidation falls in Jackson Hole week, so it could be an event reaction rather than pure exhaustion.
Kennametal: reaction at the confluence zone.
1D
4H
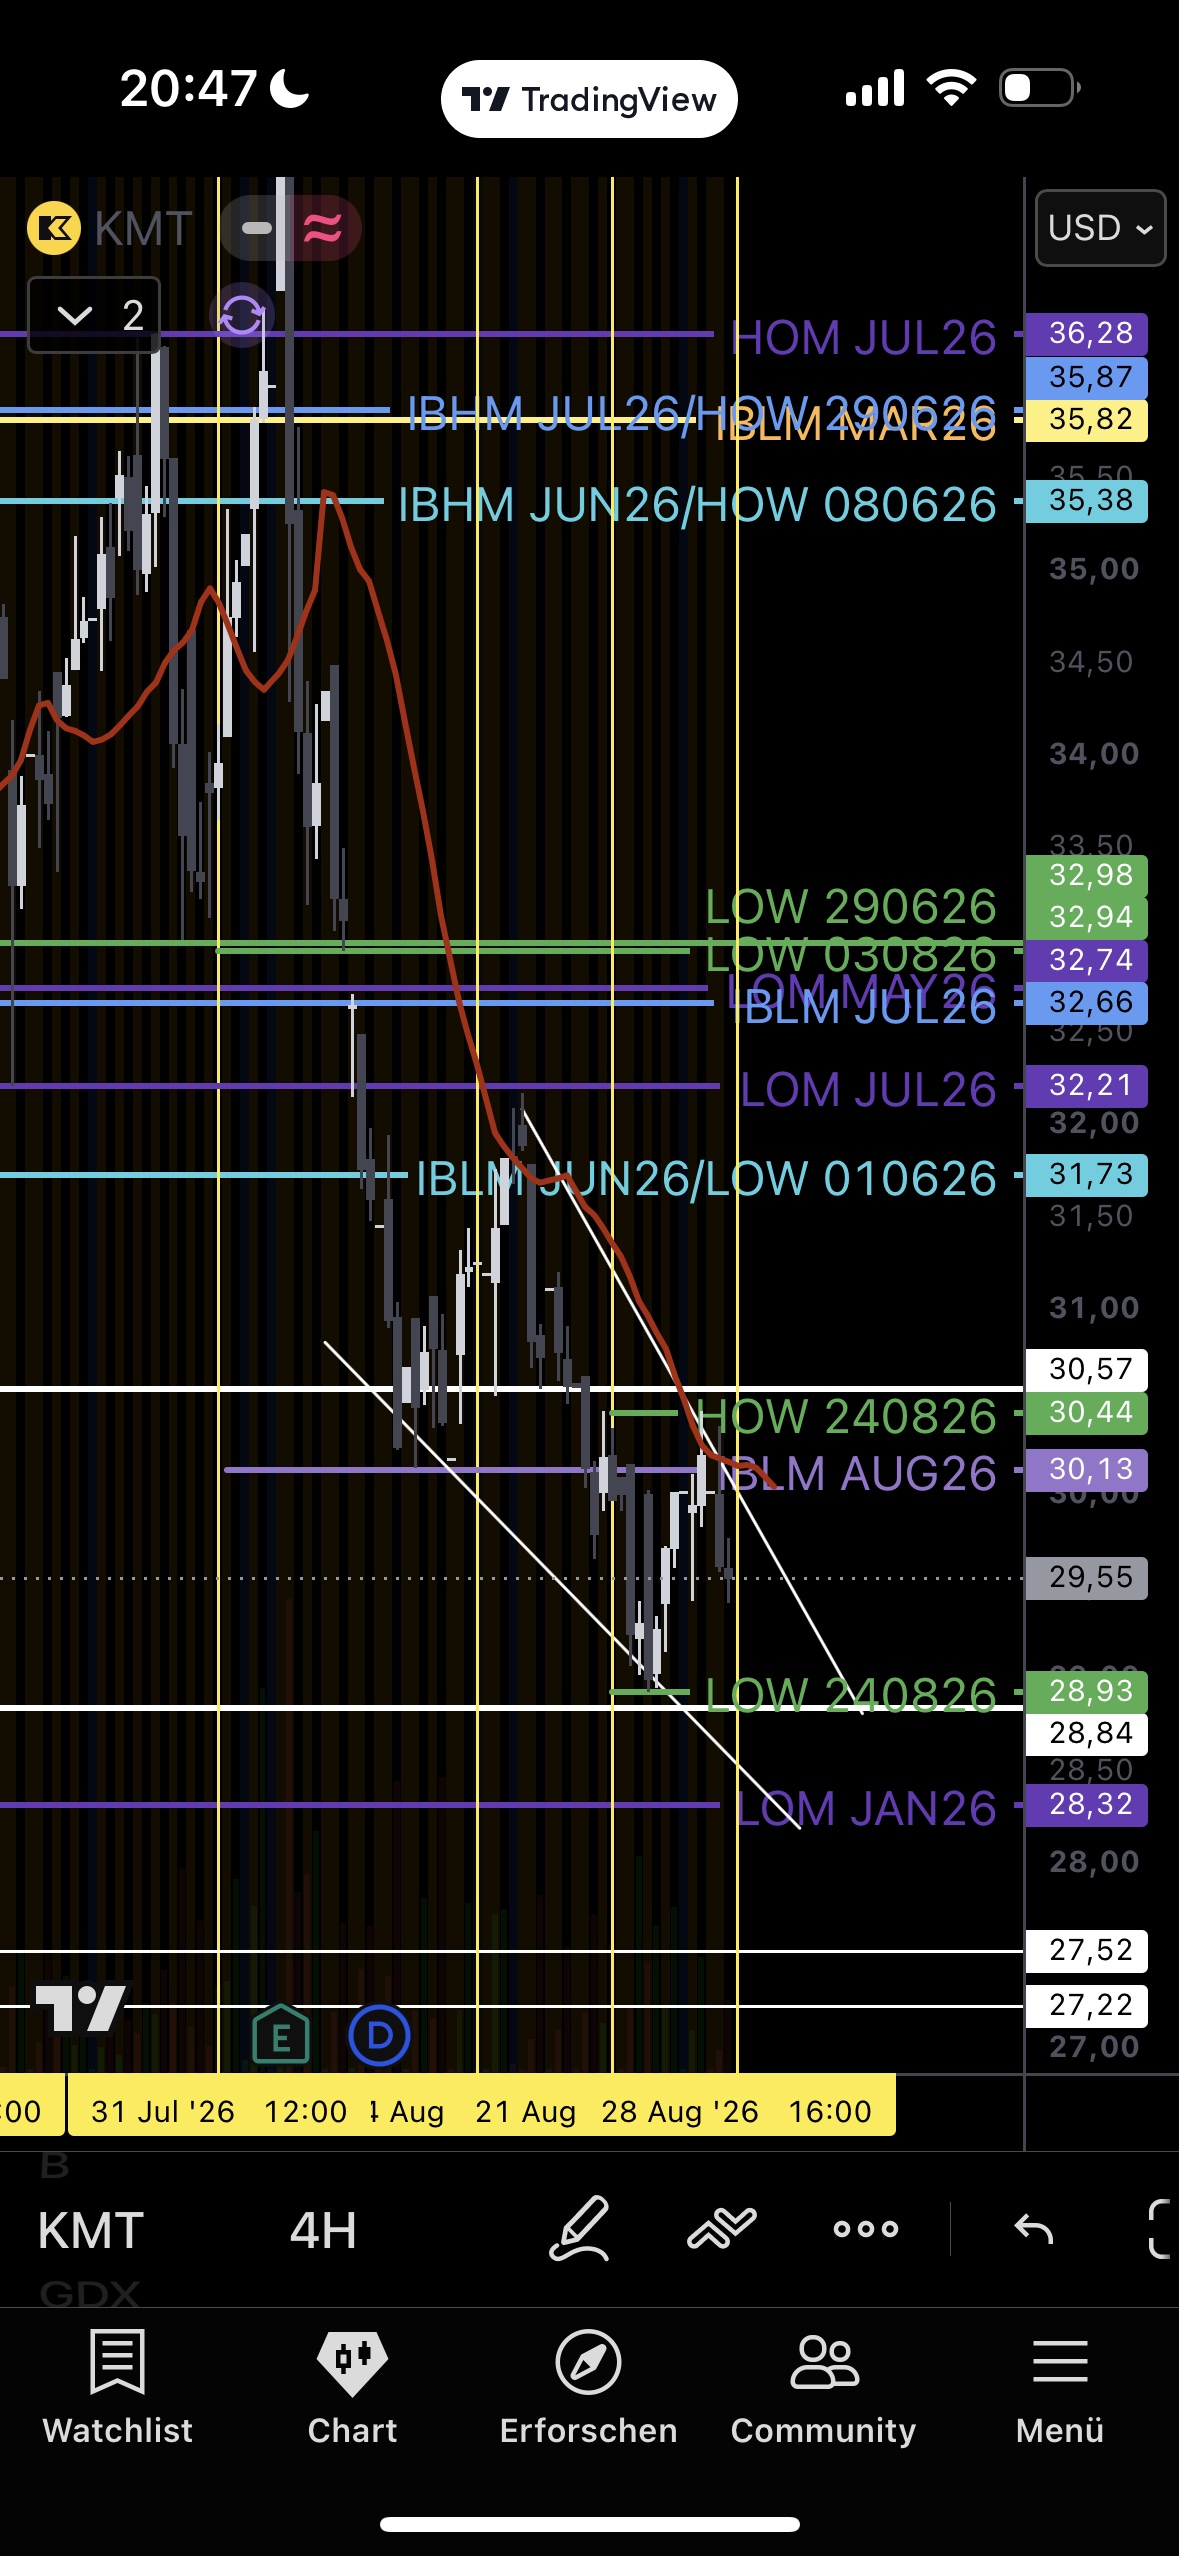
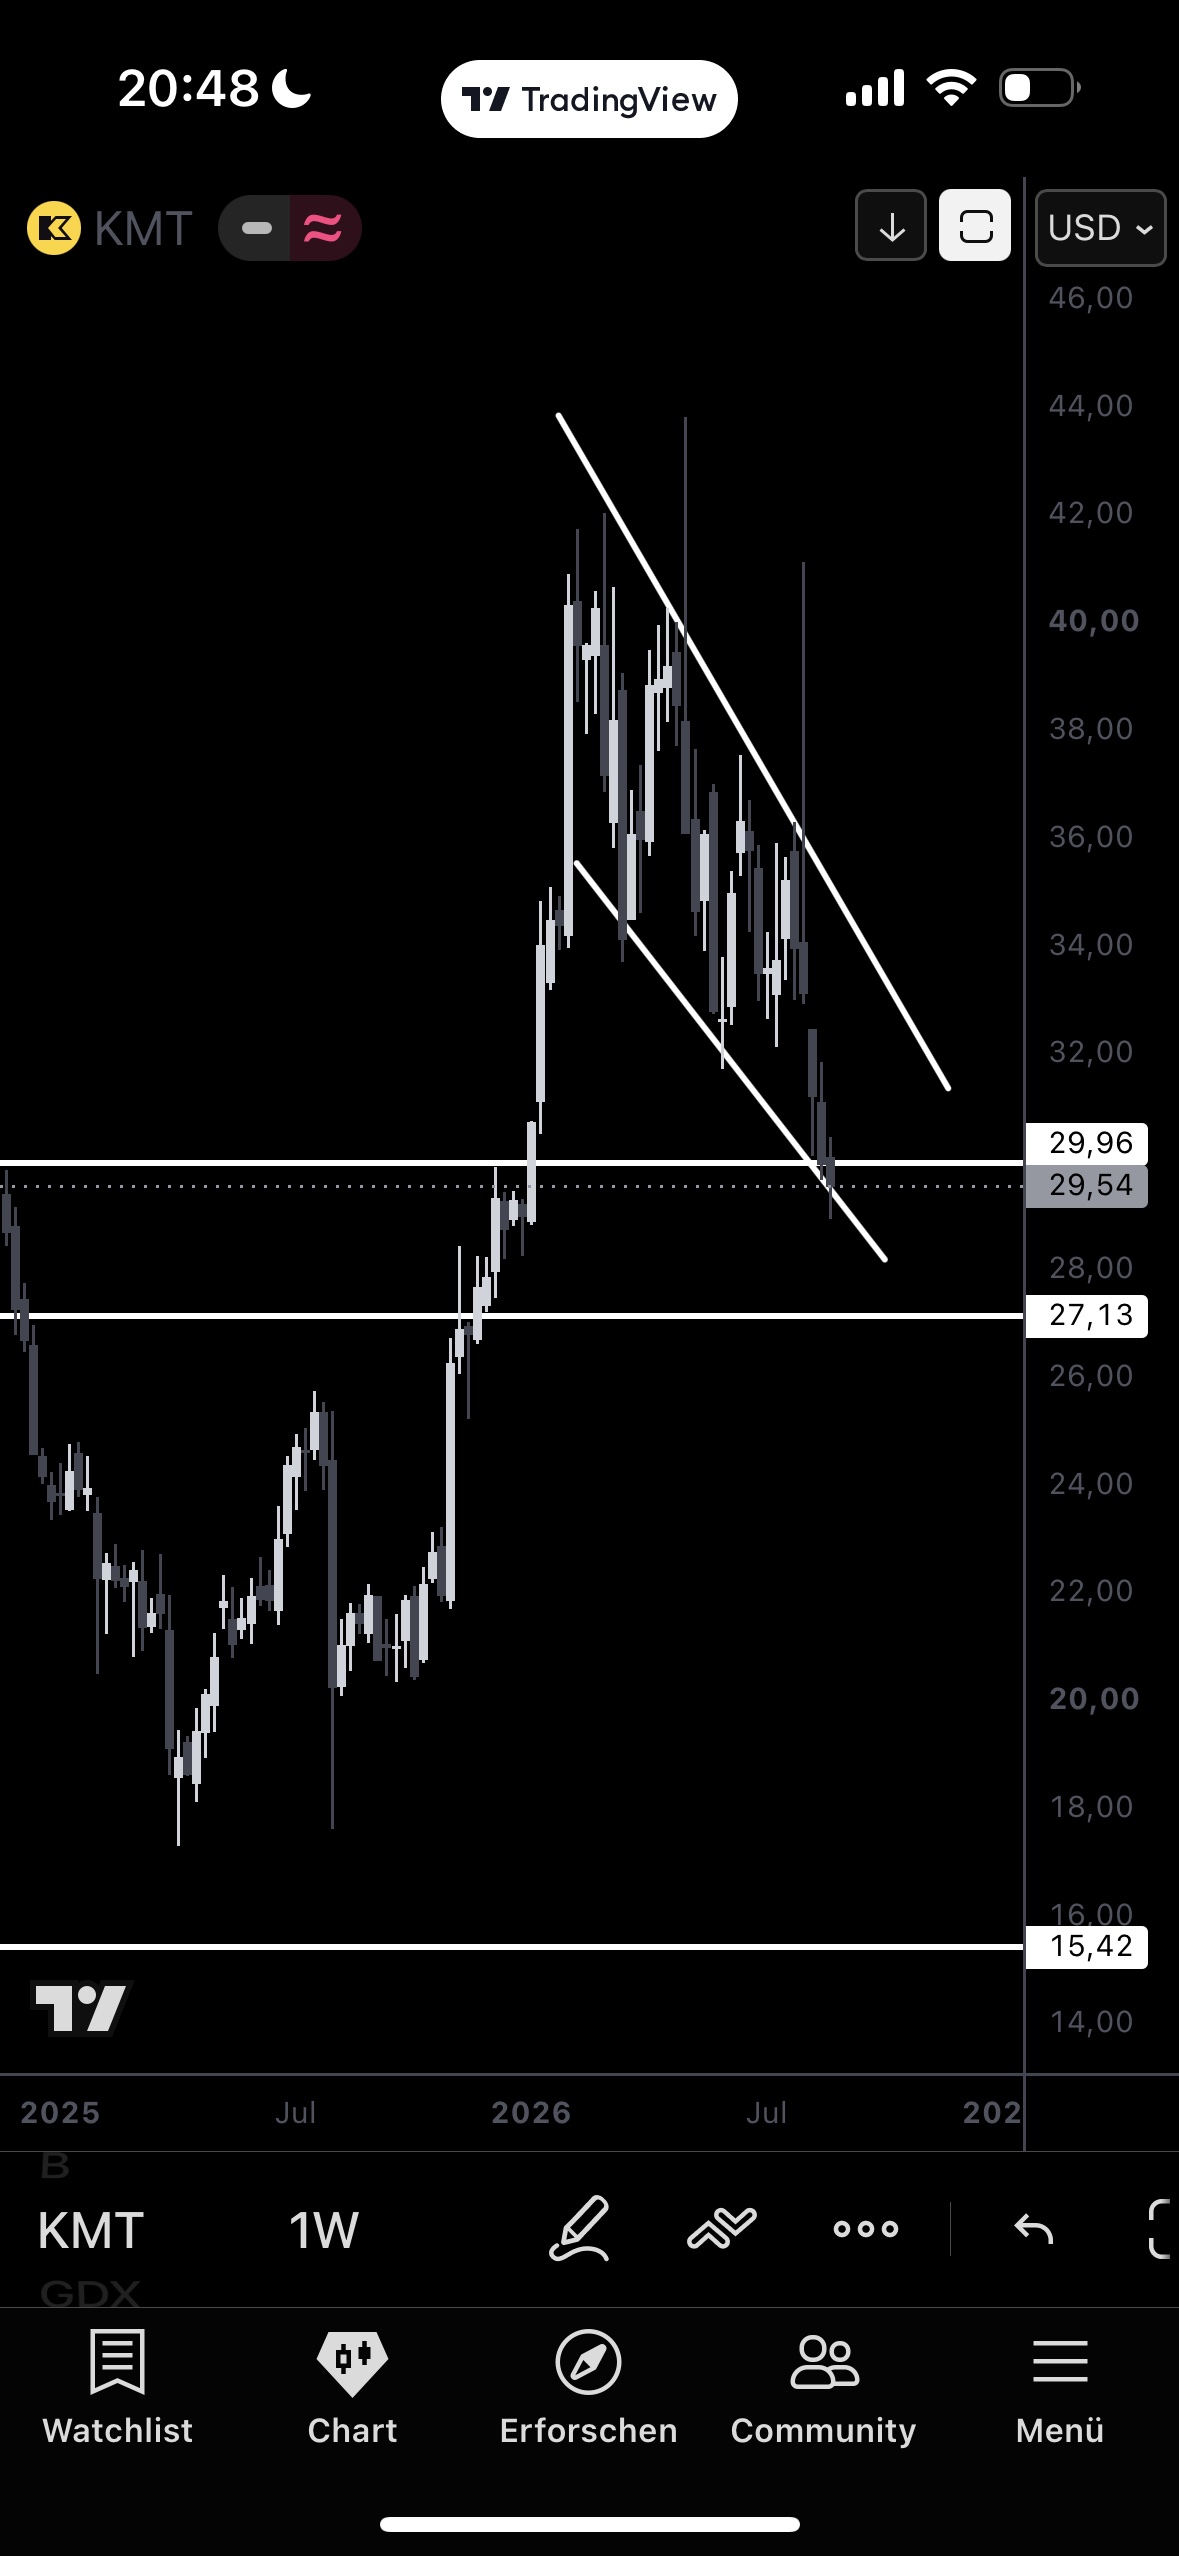
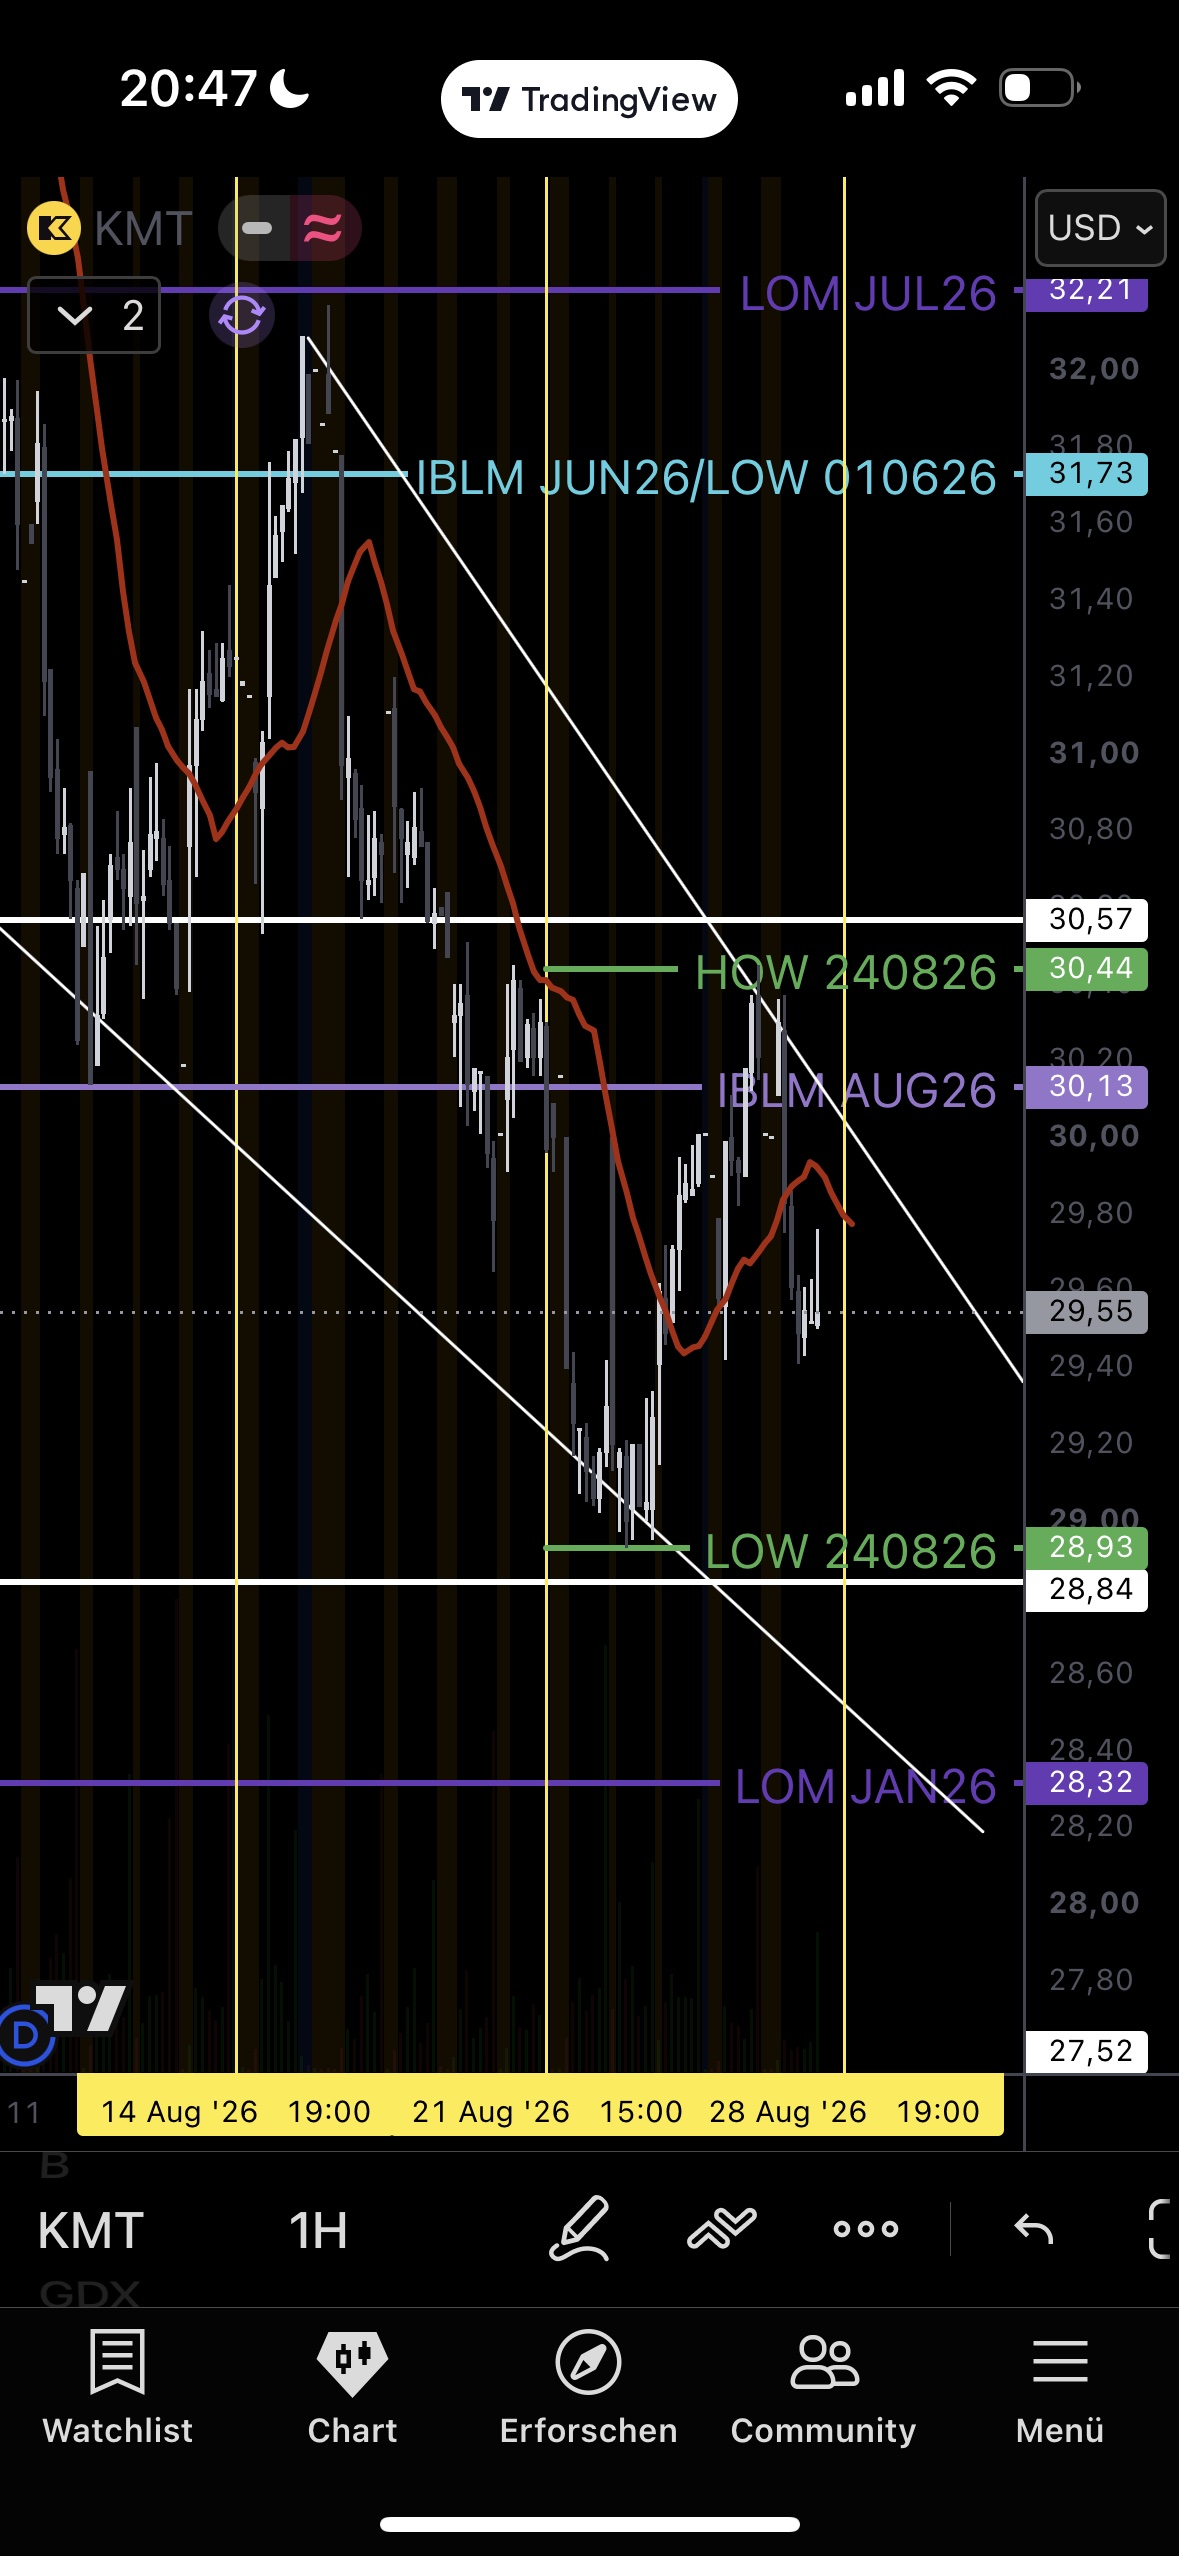
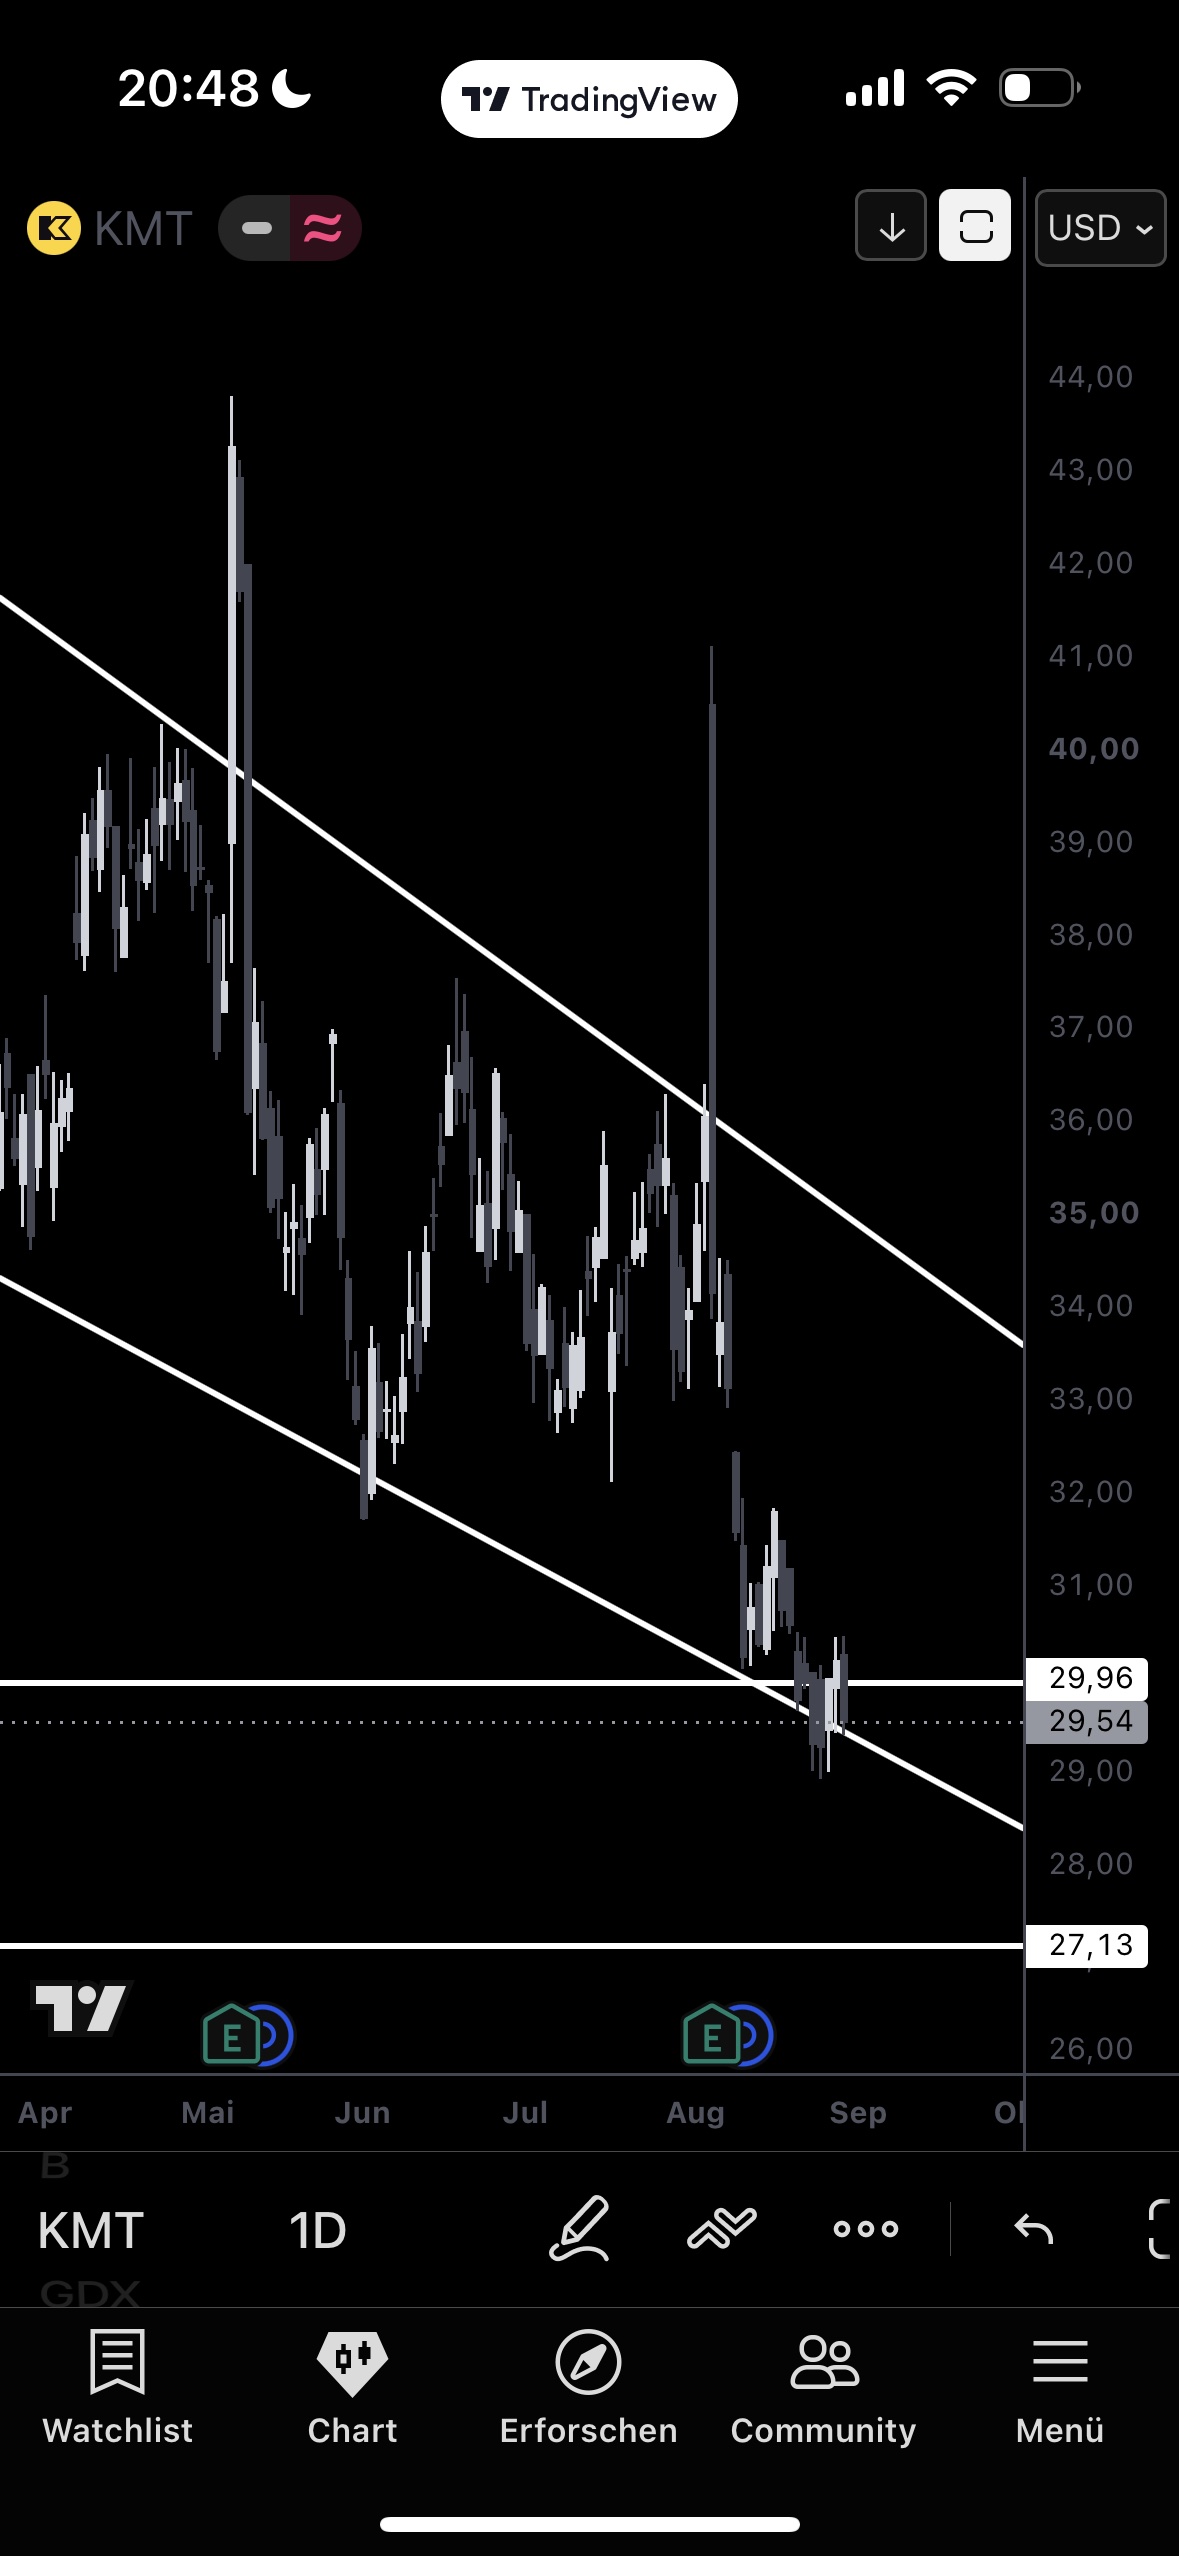
Last week's flagged confluence zone (channel lower bounds, LOM Jan '26, structural level 27.13) was tested and reacted — a low at 28.93, just above the LOM level. From there, a bounce to 30.44, currently consolidating 29.54–29.80. The reversal thesis is partly confirmed, but the bounce is real if muted — no momentum breakout. No adjustment planned on the position.
Vale: bullish trigger confirmed.
1D
4H
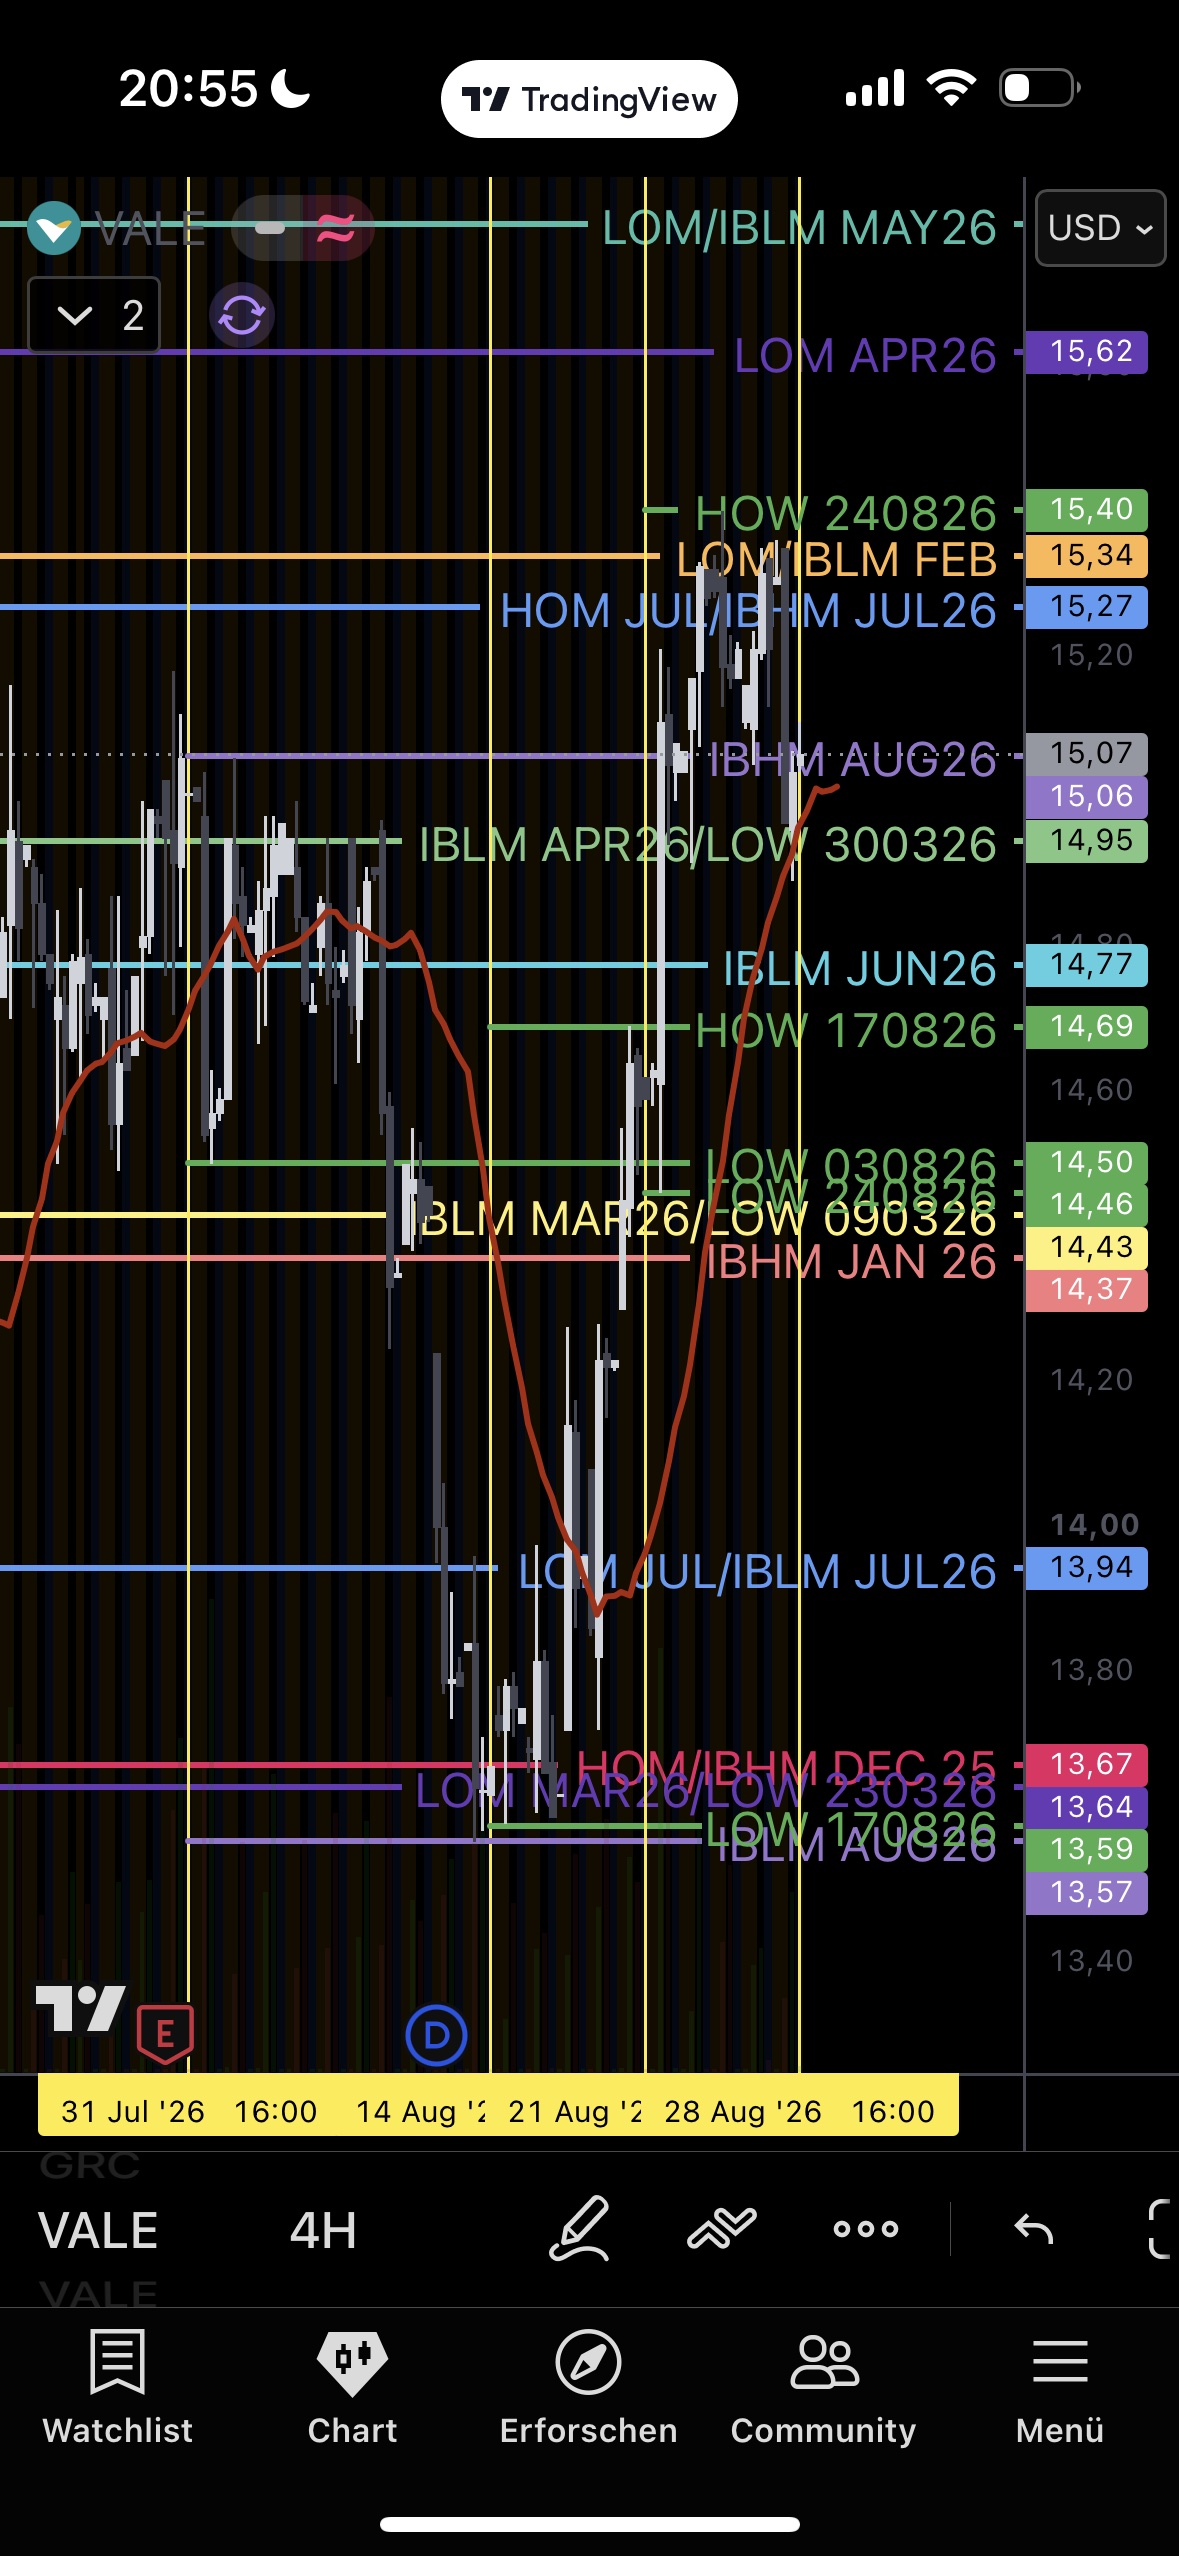
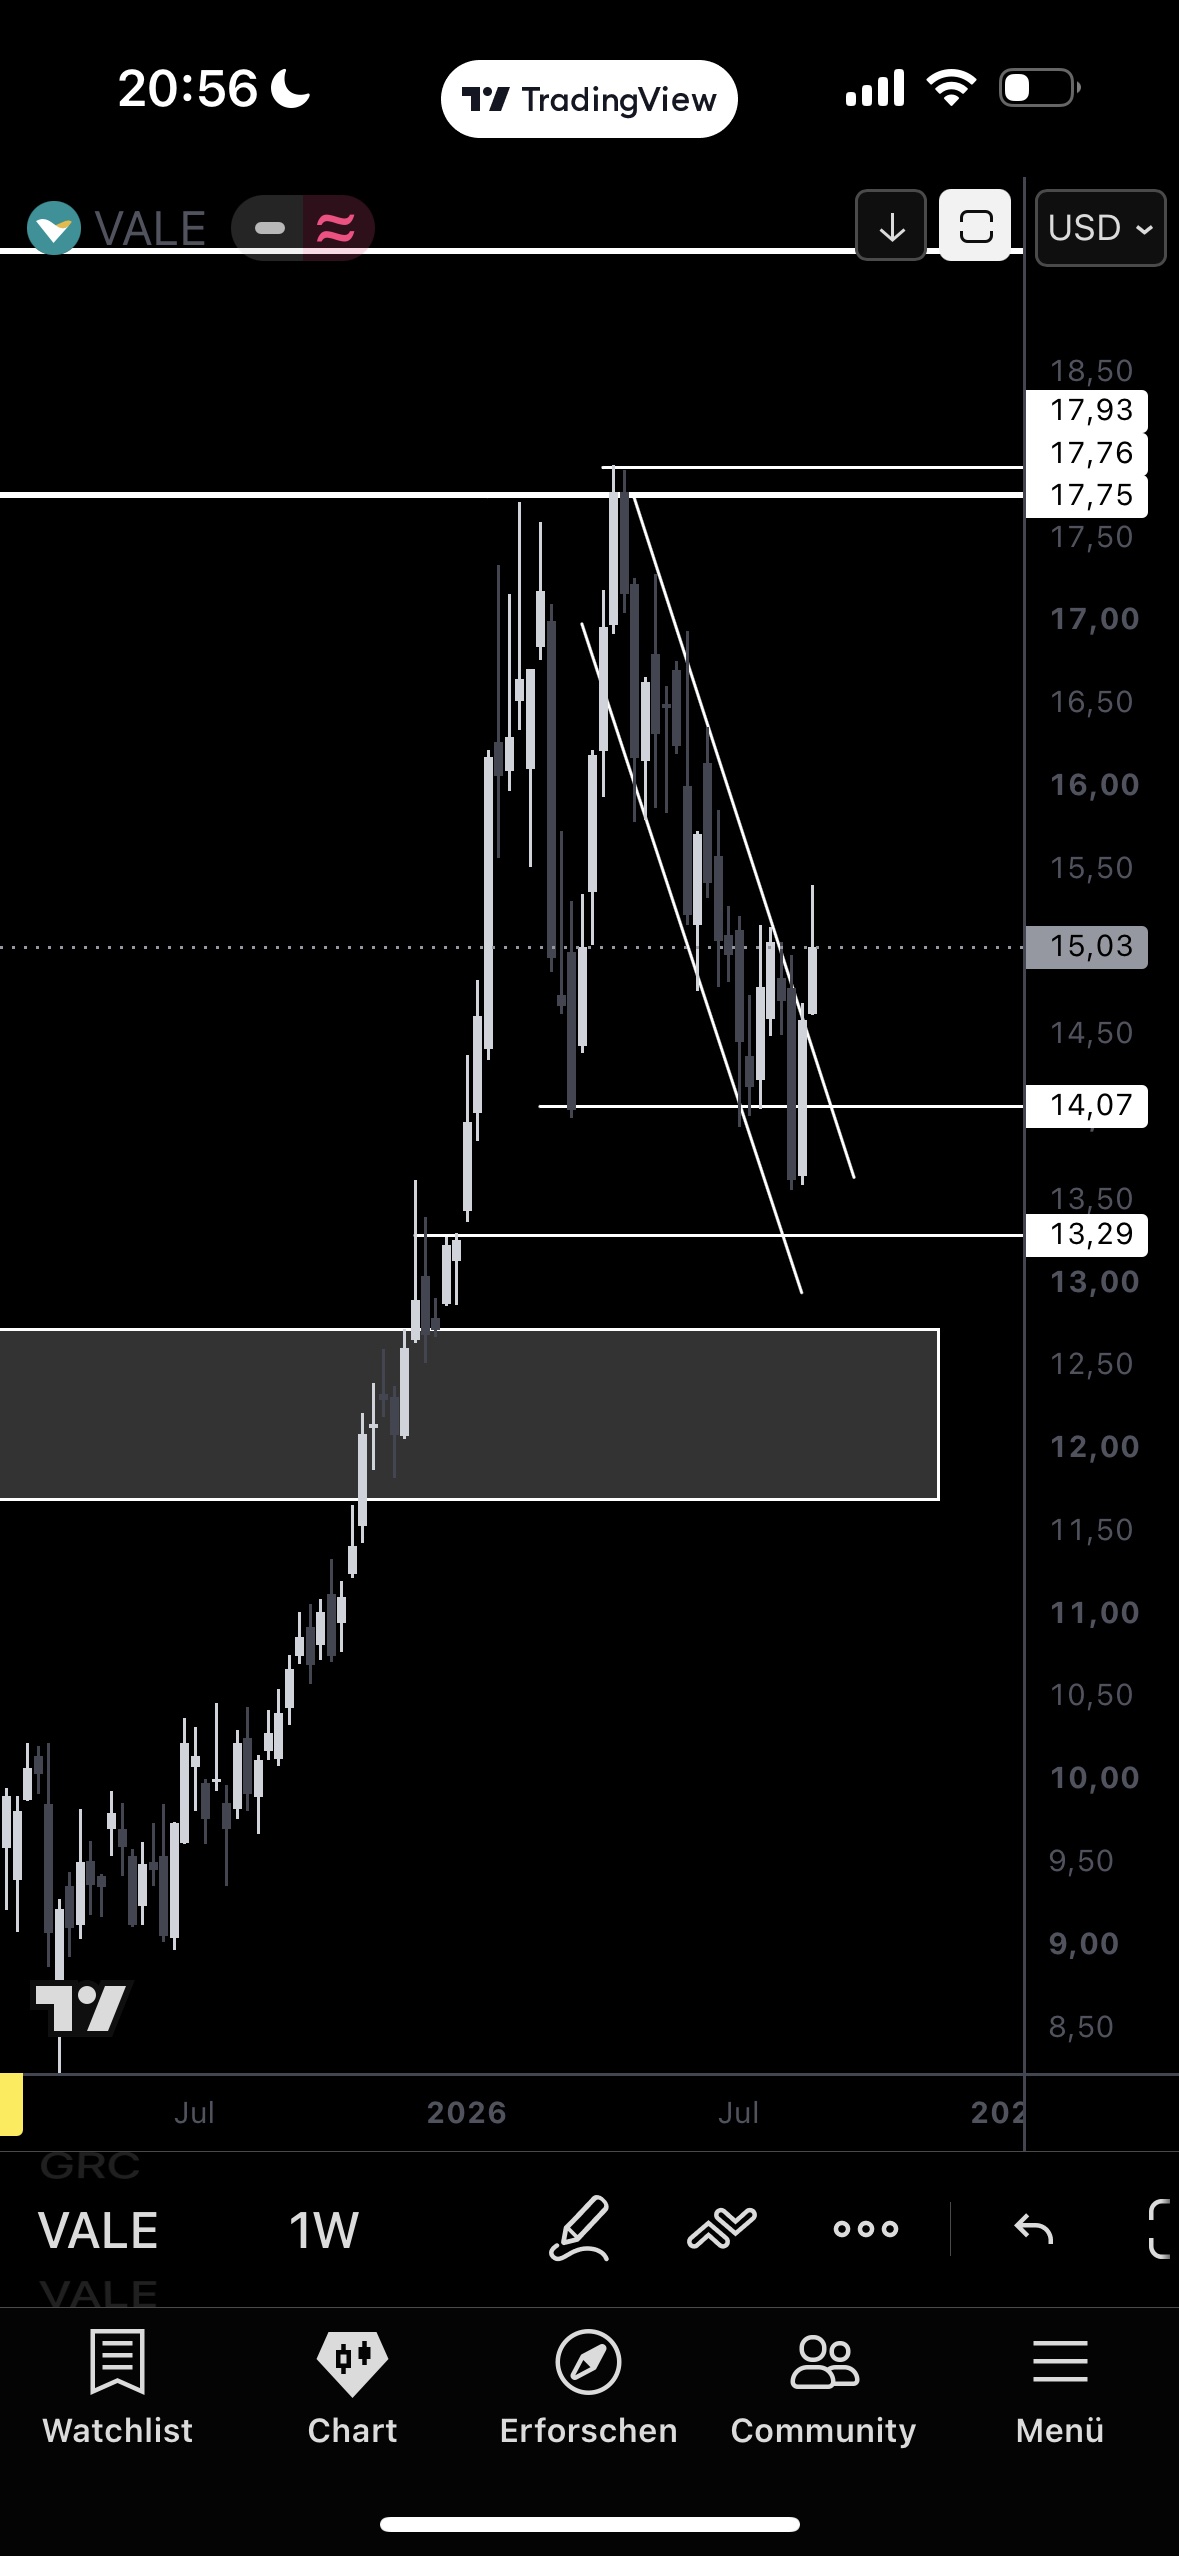
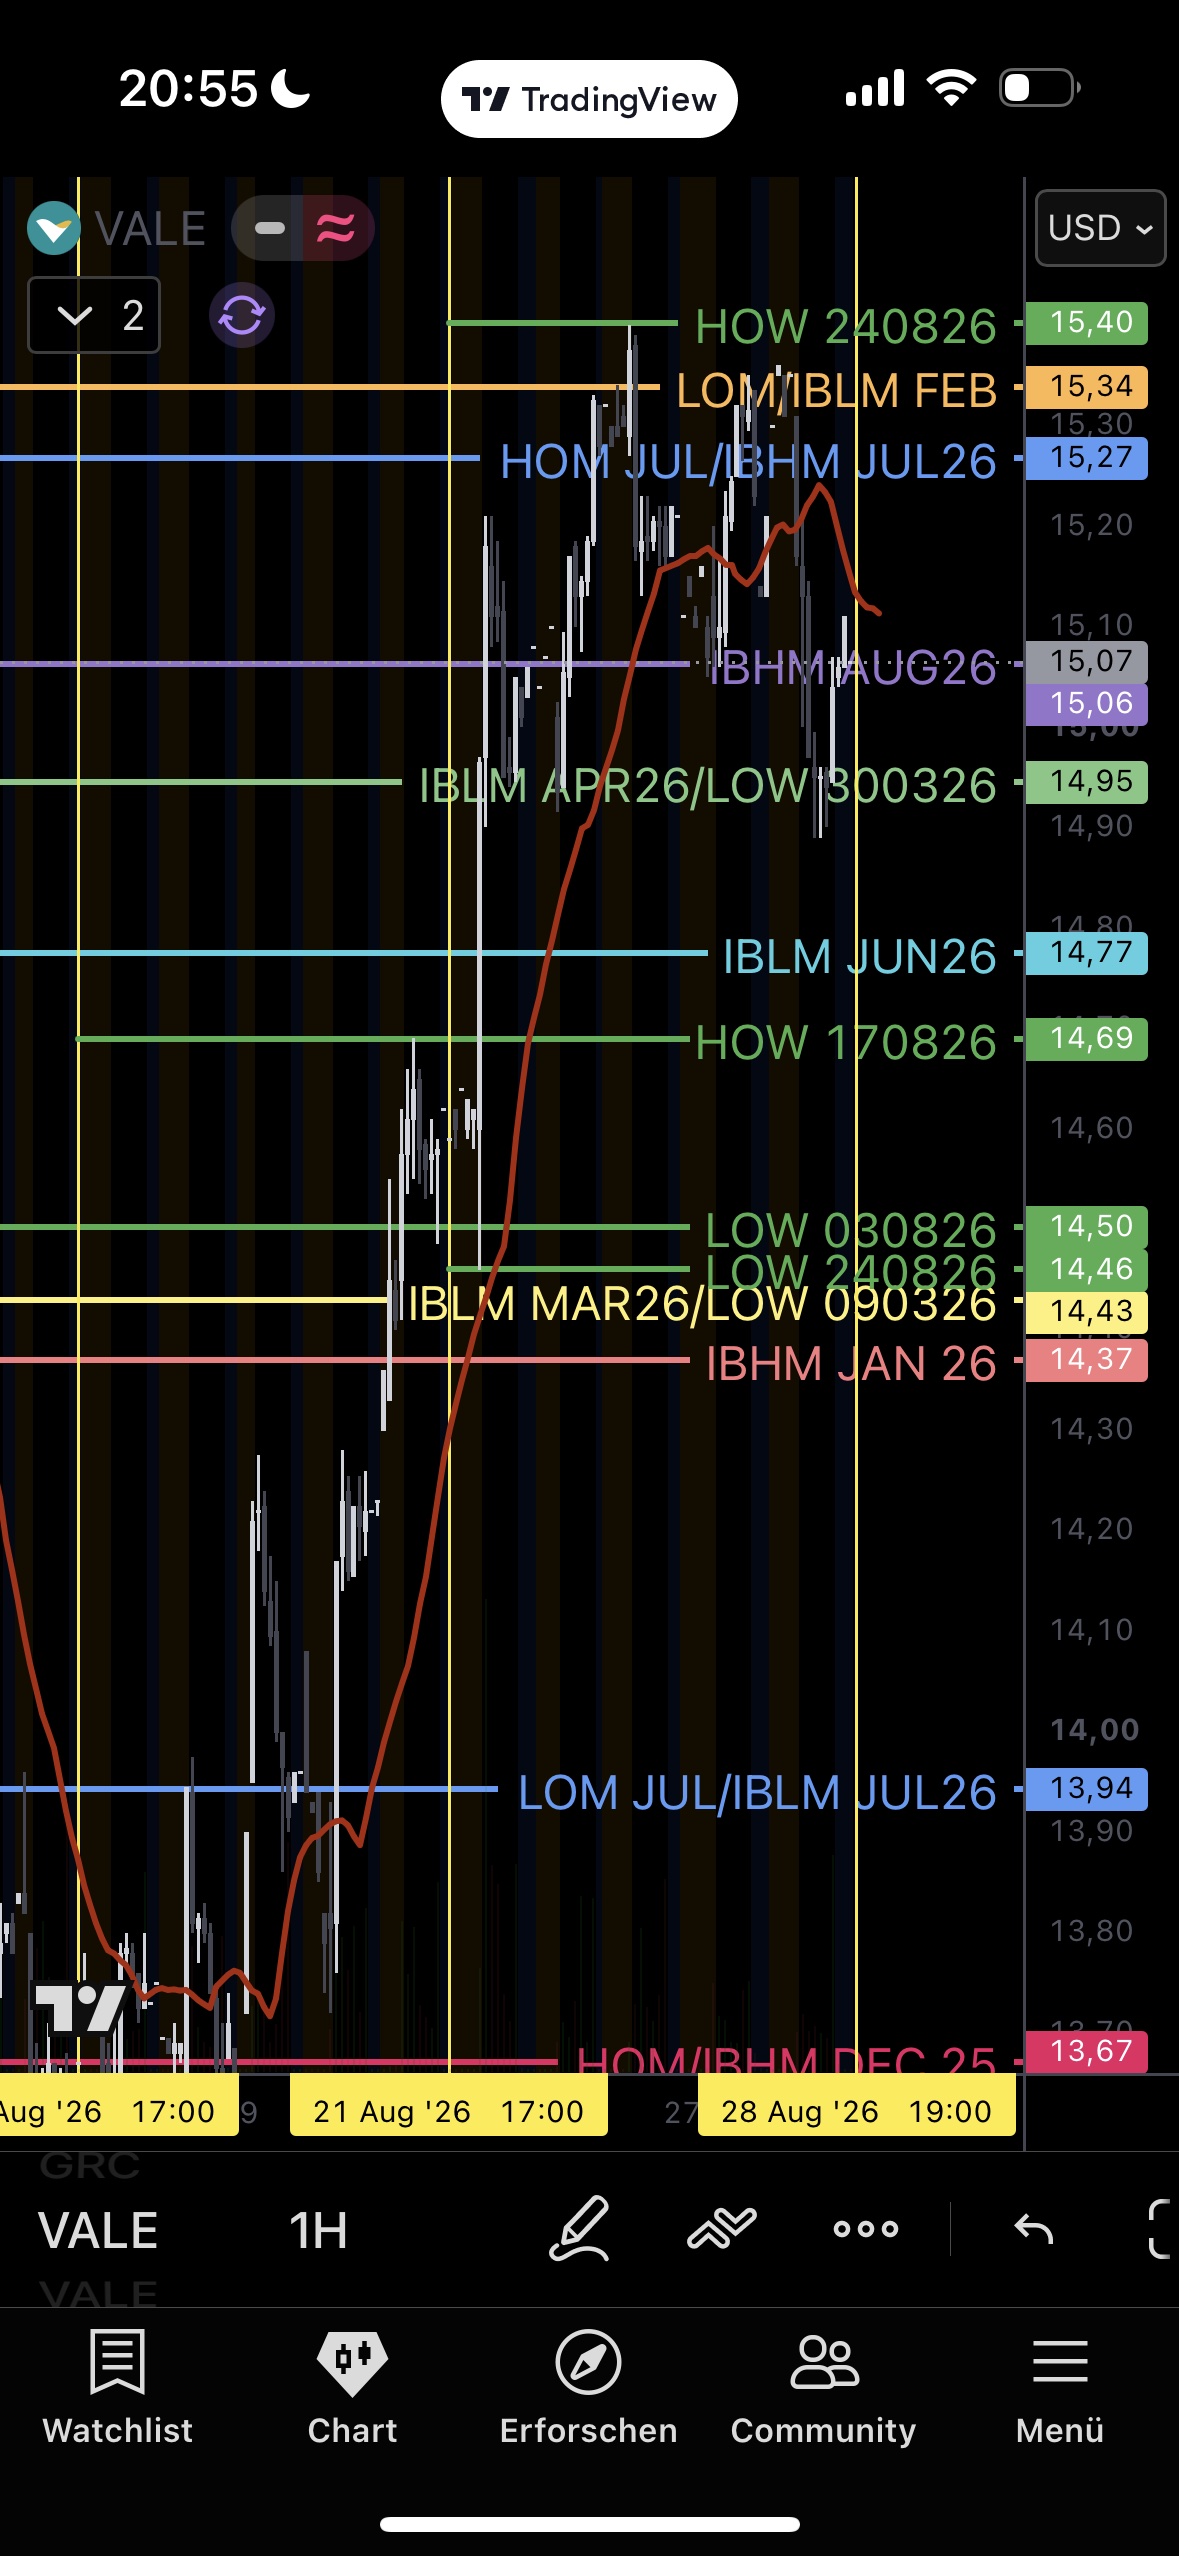
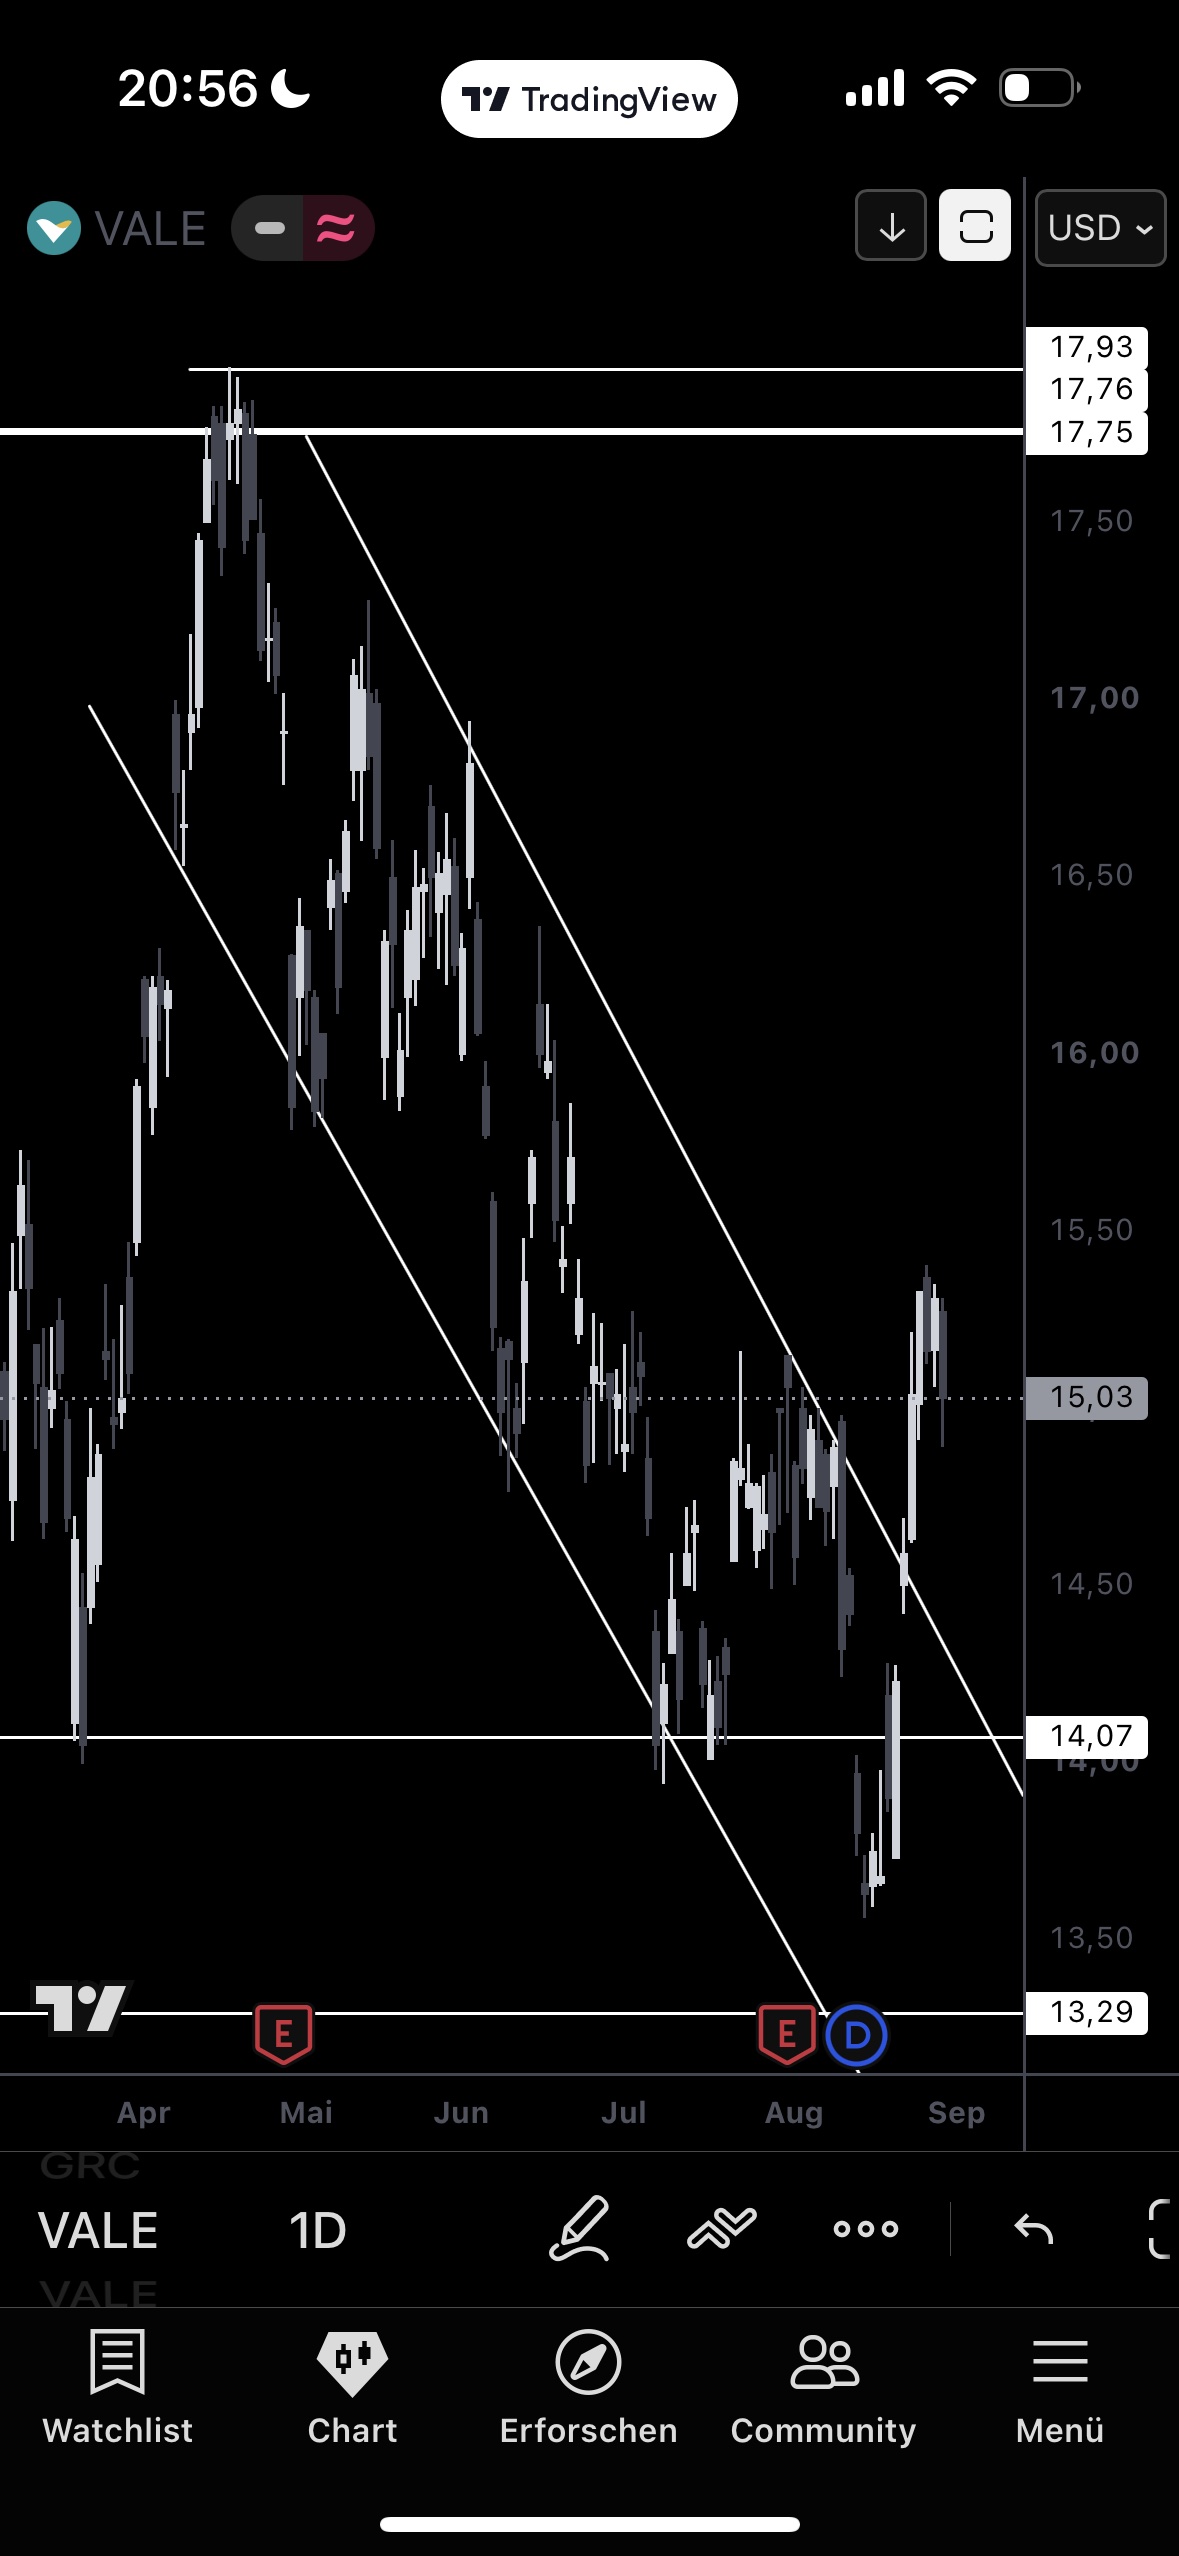
The falling channel trendline since the May high (17.75/17.93) was decisively broken to the upside on both daily and weekly — the first technical trend reversal since the high. From the reversal zone at the low (13.29/13.57, late August), a V-move to 15.40, now consolidating 15.03–15.10. Bullish trigger confirmed: sustained breakout above the channel trendline and the 14.95–15.06 zone. Next confirmation trigger: a close >15.34 opens the path toward 16.07.
Freeport-McMoRan: new 52-week high.
1D
4H
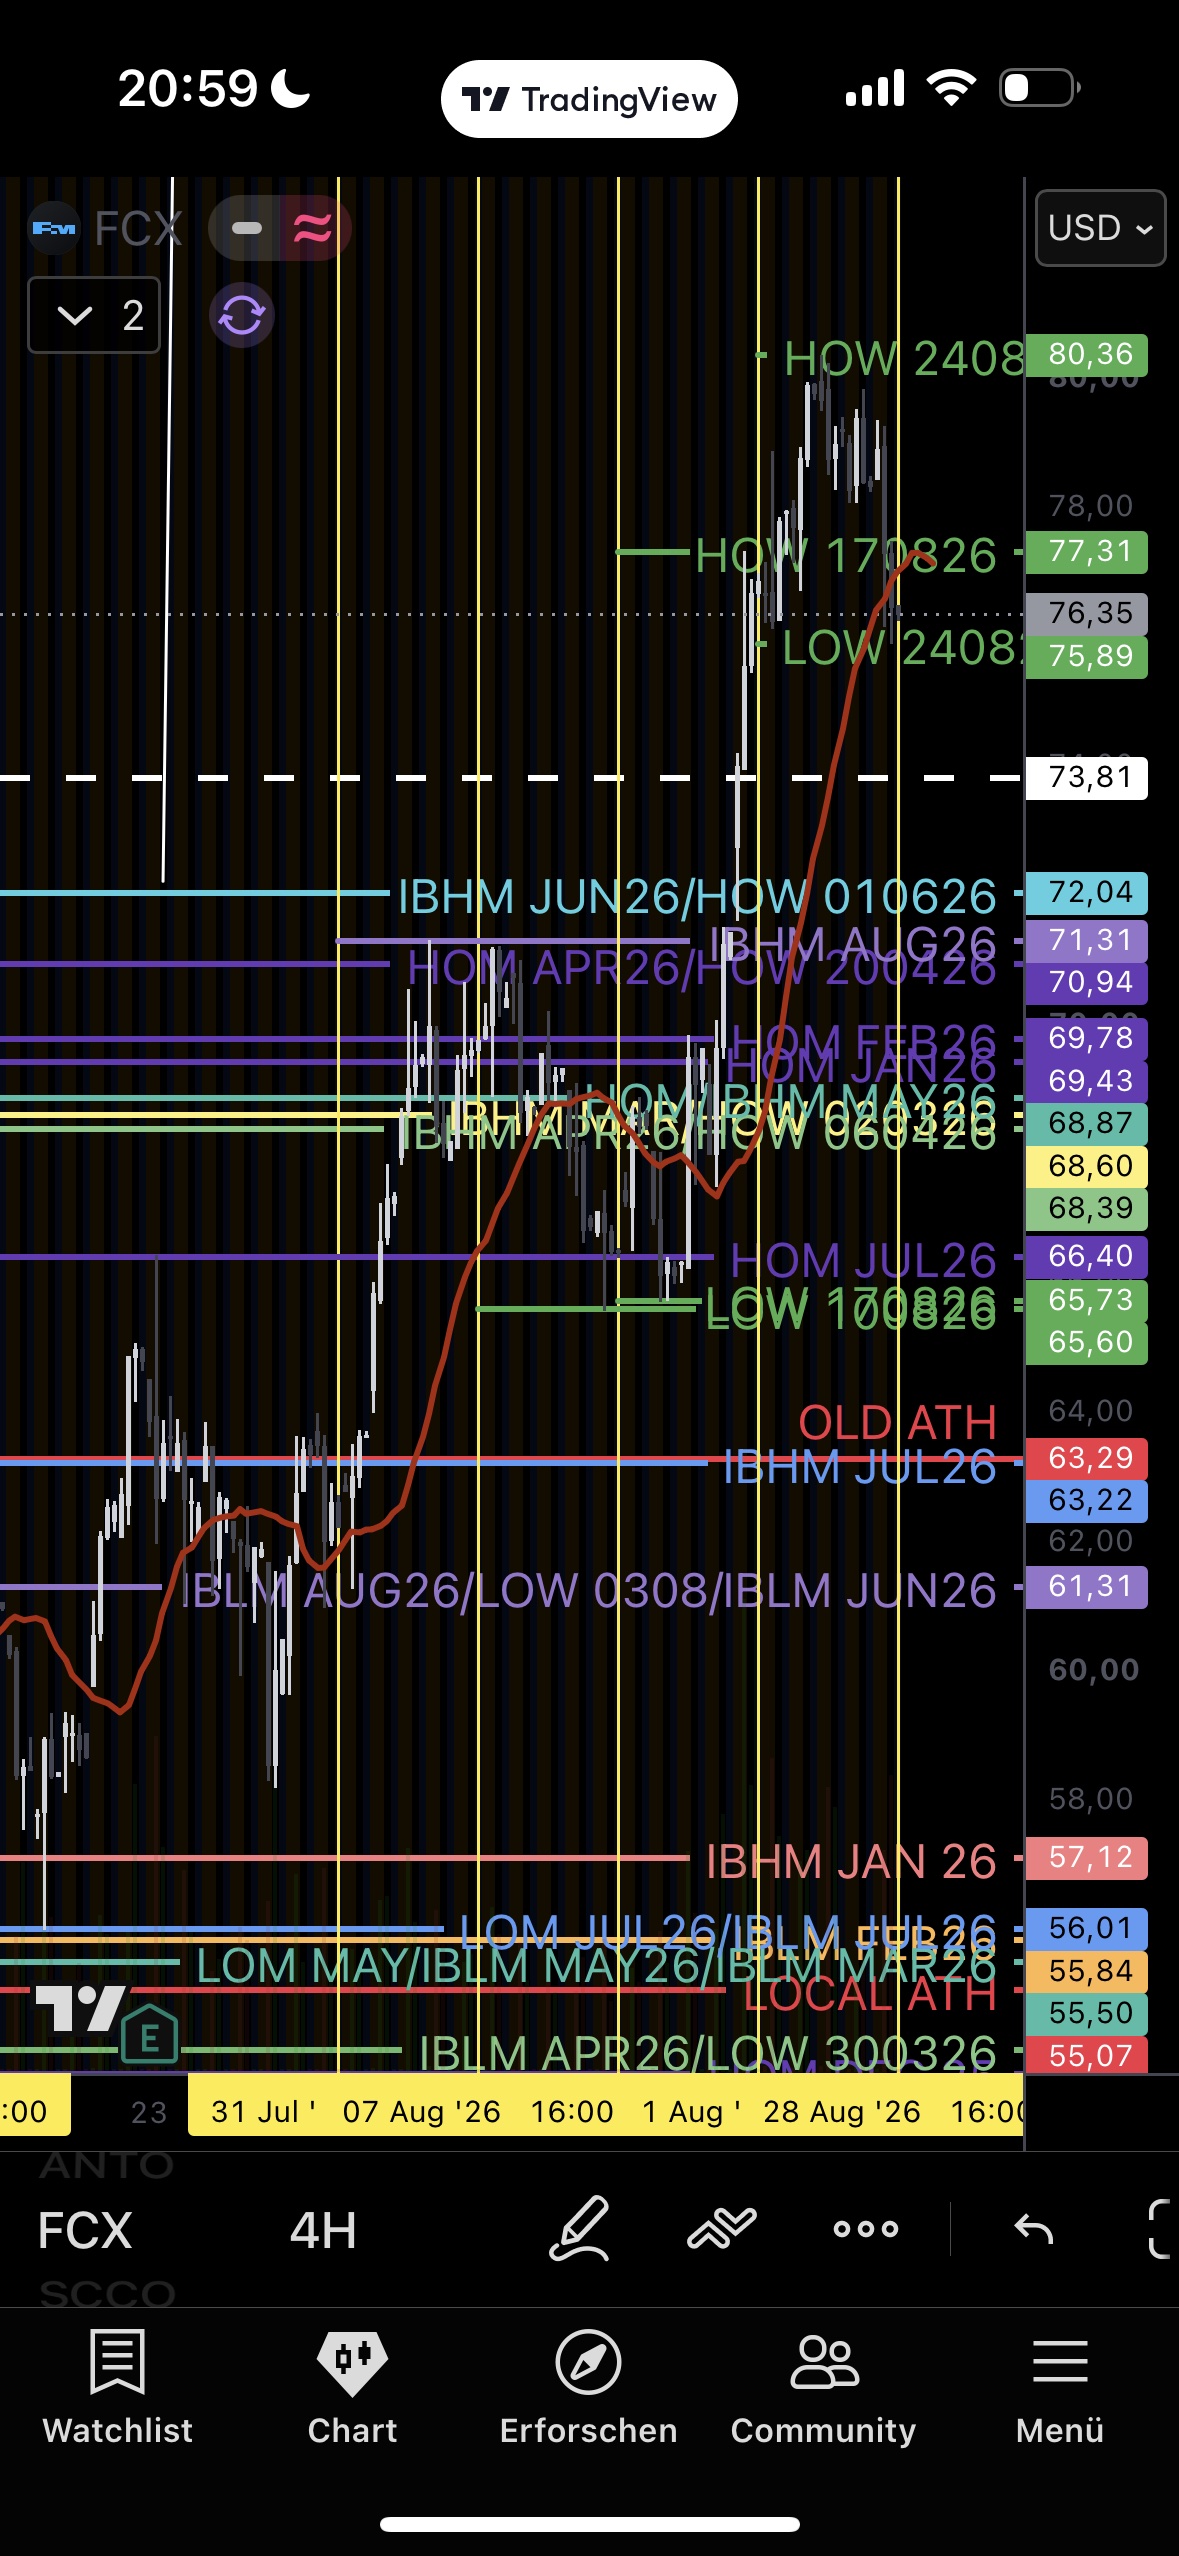
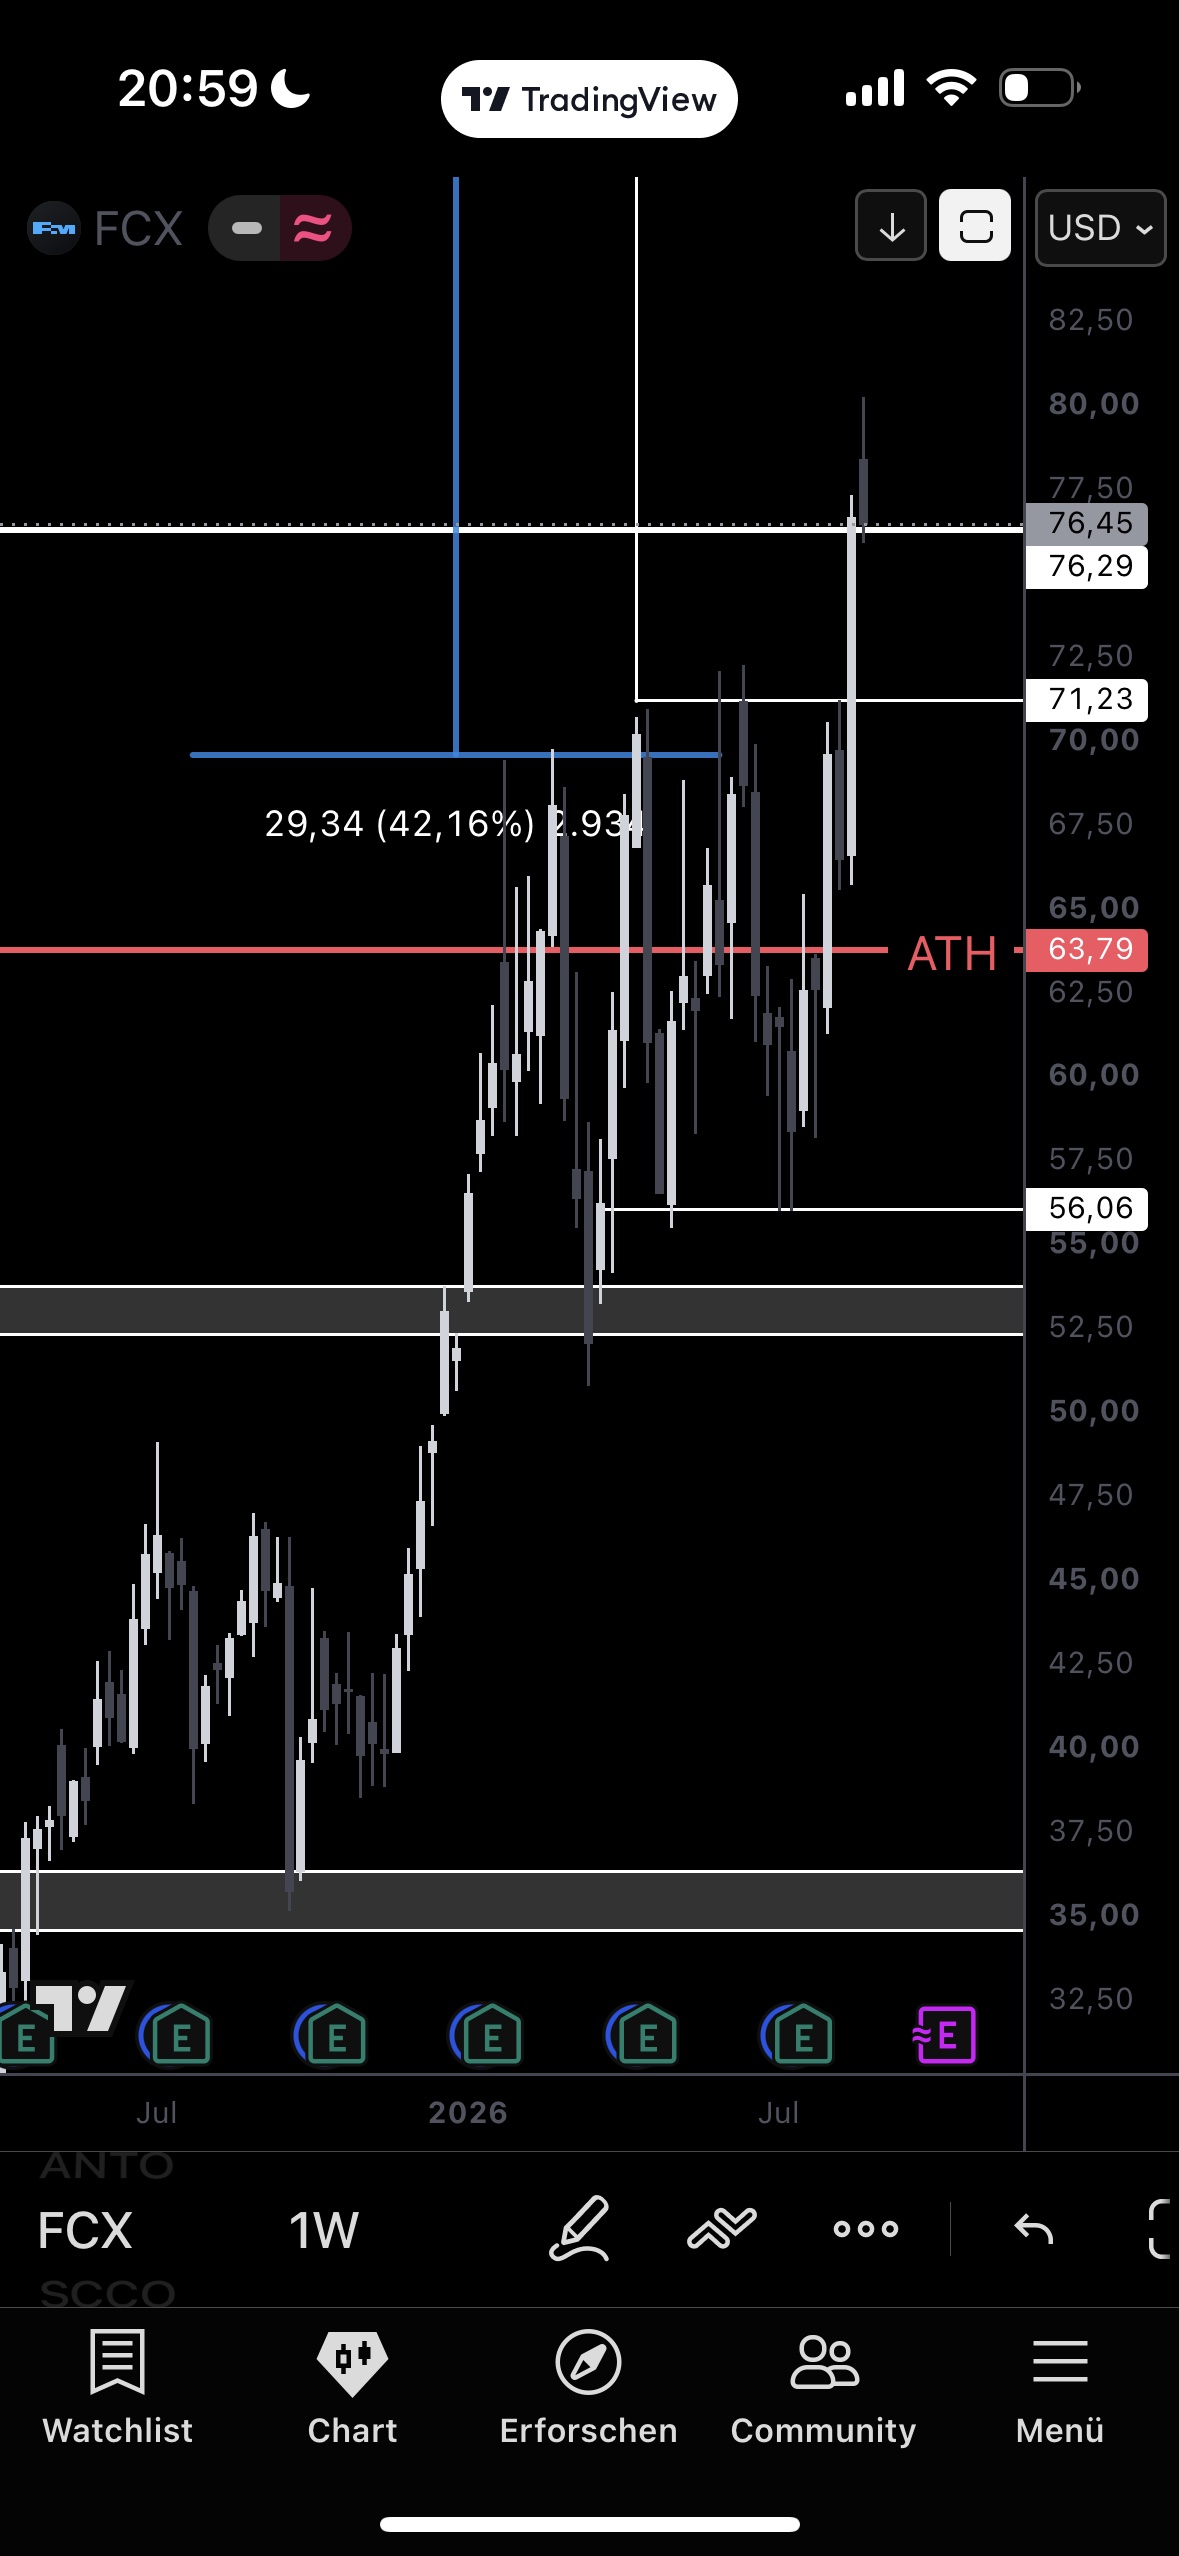
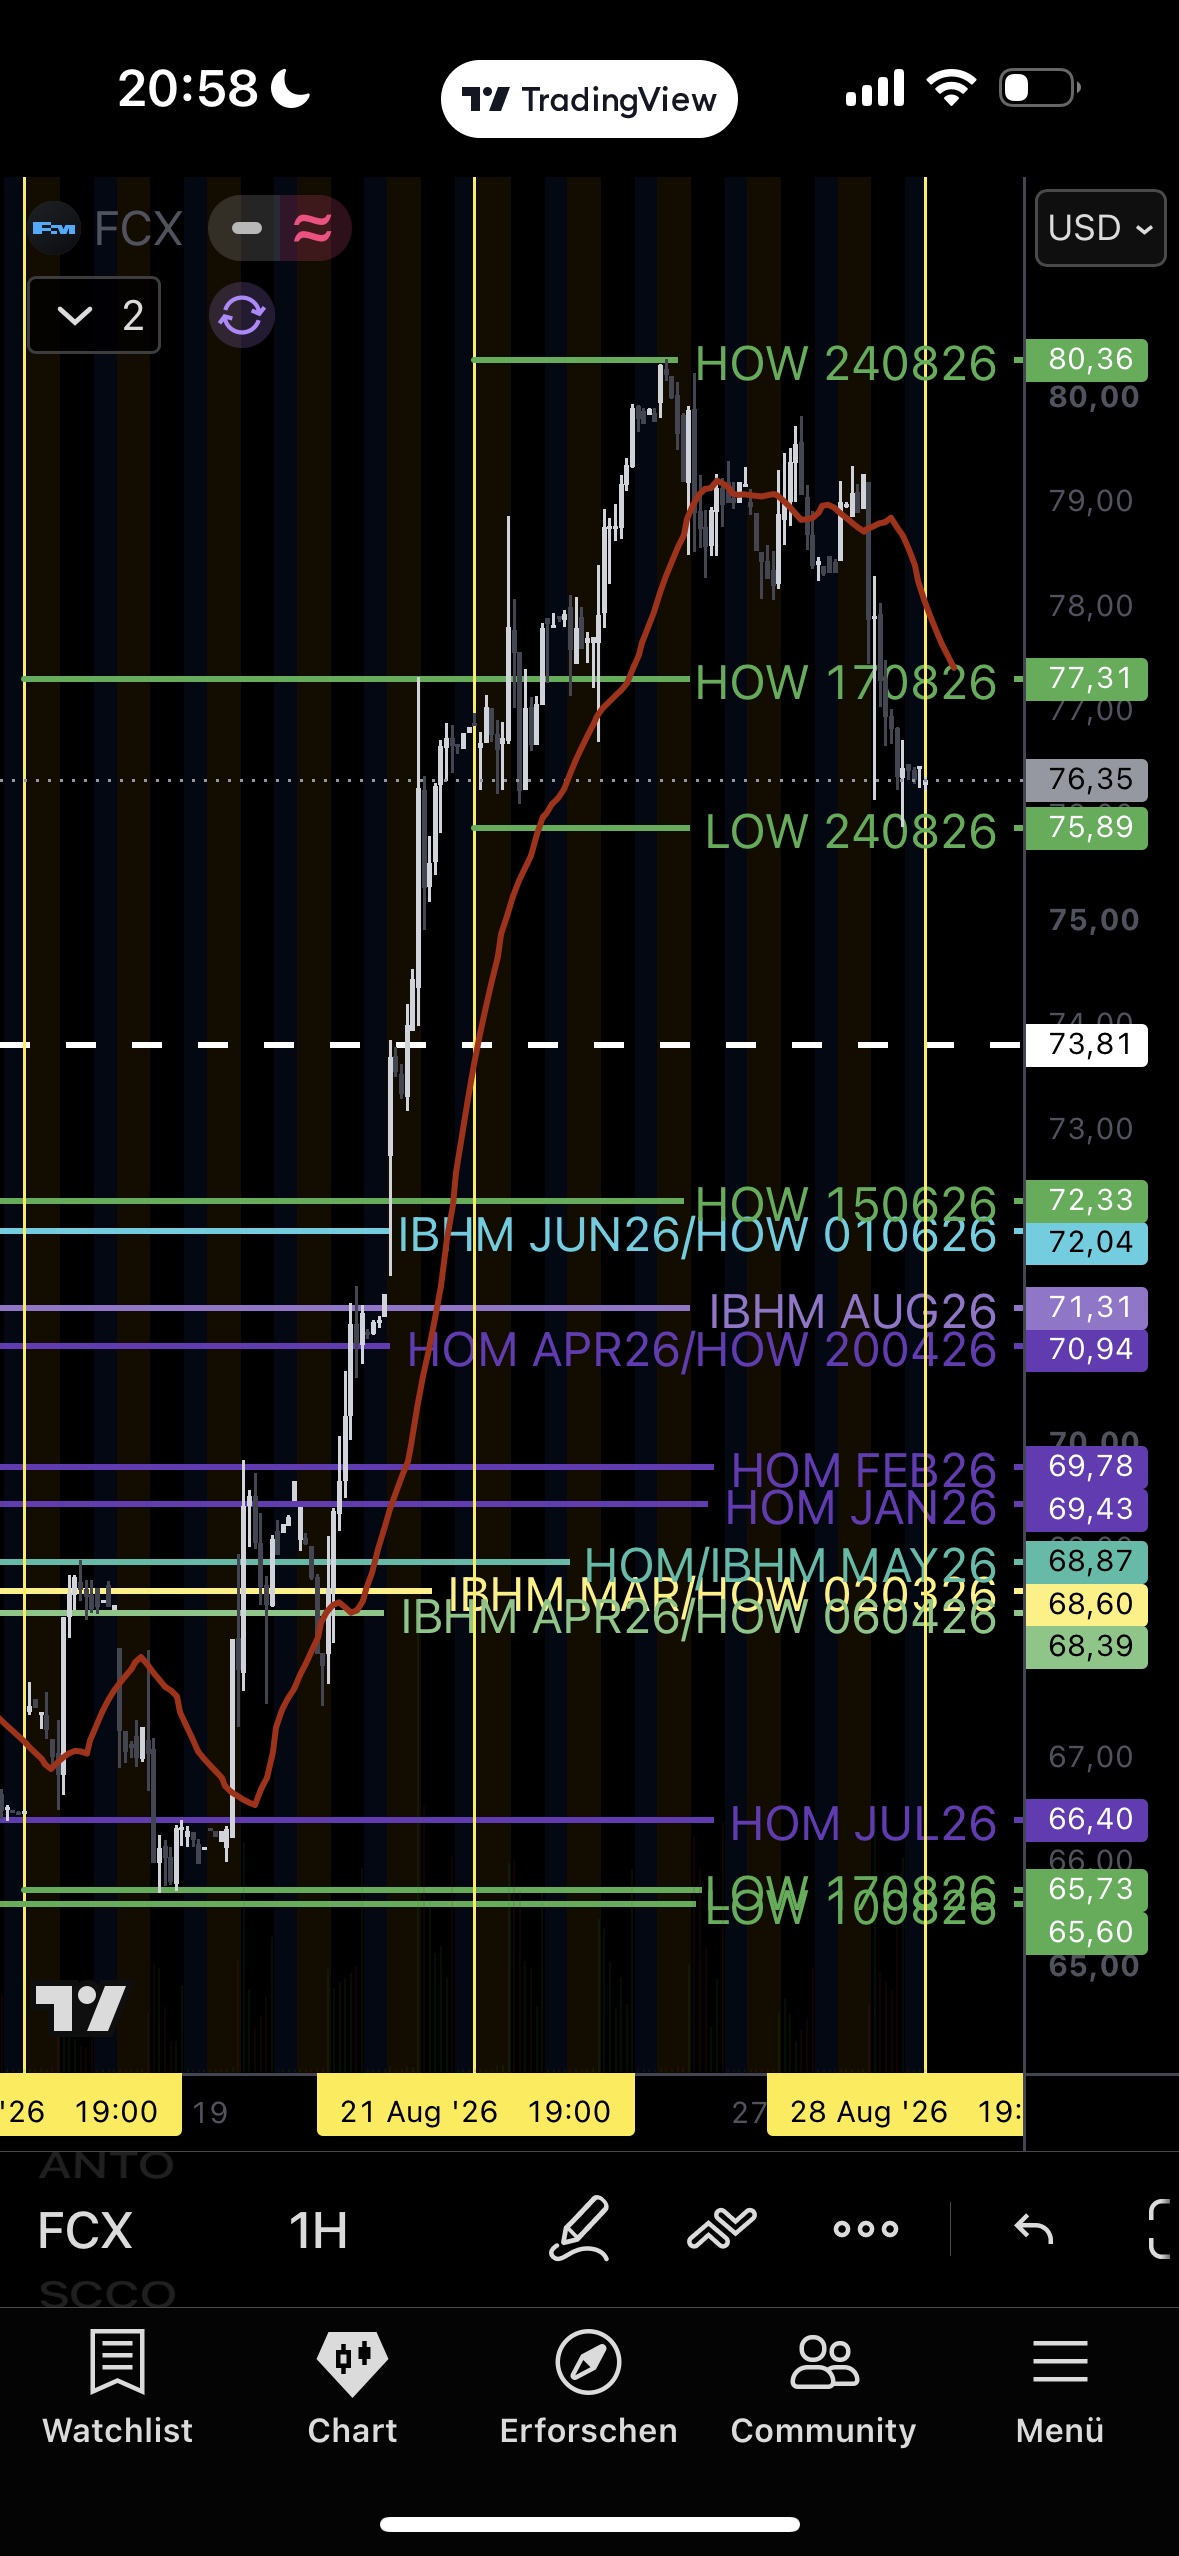
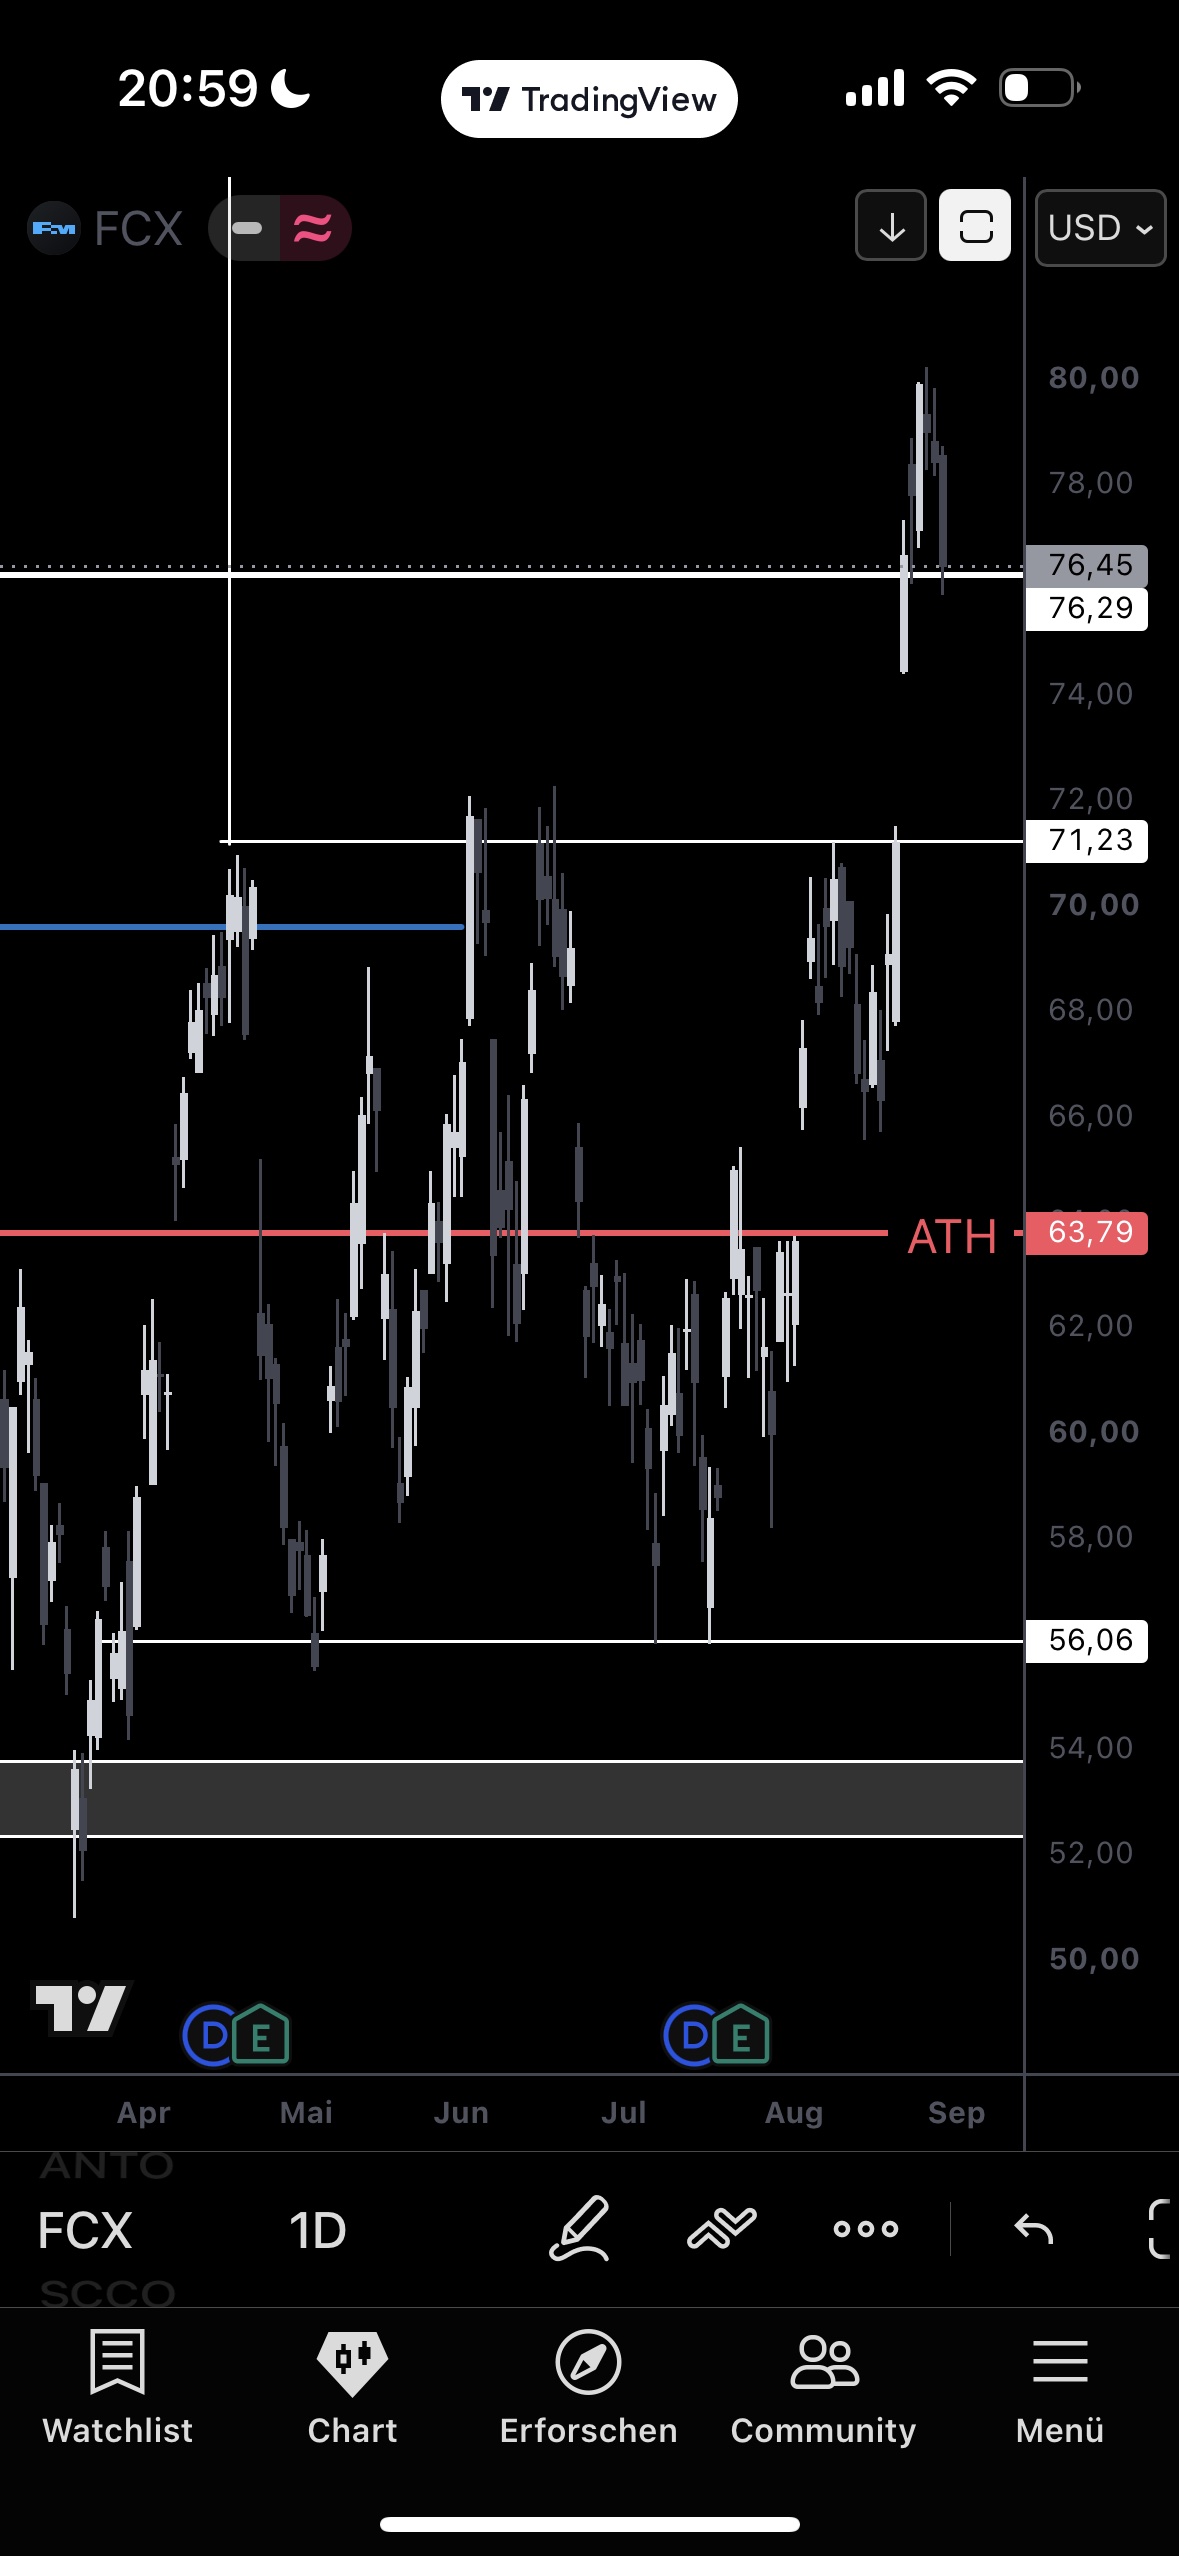
After the Aug 21 breakout day, FCX ran without a major pause up to 80.36 (52-week high) — driven by rising copper prices and raised analyst price targets. It has pulled back about 5.1% off the high since, testing the 75.89–77.31 zone. A reclaim above 77.31 → path toward 80.36 and beyond. Valuation is getting sporty (P/E ~37.6x) — the room for rapid acceleration thins without fresh copper impulses. FCX remains the leader, not the follower, of copper itself.
WEEK 12▸
Two maps. One decision.
I don't predict prices. I map two forces.
The auction tells me where price actually did business — Market Profile levels, drawn by hand, every week. It's the same auction logic I trade every day in the E-mini S&P; the miners just move slower. The business tells me what a company earns at today's metal price — my fair-value fan.
Where both maps agree, I act. Where they disagree, I wait. That is the whole system.
The weather system behind the trades
Every market lives inside a macro weather system. Mine has four legs:
Legs 1–3 drive the metal price. Leg 4 drives the multiple the market is willing to pay. Two different axes — one fan.
Important nuance on Leg 3: rising rates don't automatically mean liquidity is drying up. If UST is being sold off in parallel, that releases liquidity — and if the Fed balance sheet keeps growing at the same time (Leg 4), that at least partially cushions the headwind from Leg 3. That's likely why the Warsh-week yield spike hit the invalidation zone without gold, silver, or copper actually breaking down.
Newmont: a position inside a mapped space
LEVEL SAYS → trigger 121.99 fired · now 131.58 · one lot sold at 14.77 (~5x)
BUSINESS SAYS → fan at $4,600 gold: $115–230 · market pays ~10–11x
I'M DOING → full runner to the 135 strike. The level decides, not my hope.
I started buying with the stock at $115. It fell to $88. I didn't leave — I bought more, because my levels and my invalidation were intact. My cheapest lot cost $2.89 per call. Then the trigger fired. One lot I sold at 14.77 — roughly five times the entry — not out of doubt, but to fund a new trade. The rest runs toward the 135 strike. At today's gold price, the fair-value fan spans $115 to $230. My position is not a bet on a number — it is a position inside a mapped space.
Wheaton: the 351 question, answered honestly
LEVEL SAYS → 138.87 flipped · now 157.78 · chart projection 351.65
BUSINESS SAYS → 2026 GEOs: 351 needs ~34x · 2030 GEOs: ~26x at $5,500
I'M DOING → holding. The 351 is a growth story with a timestamp — not a promise.
A streaming company — fixed costs, pure leverage on the metal. My chart projects 351. The model answers honestly: at today's production, that needs extreme assumptions. With the 2030 growth to 1.2 million ounces, the same target becomes reachable at normal multiples. The projection is carried by growth, not by fantasy.
Hecla: tension is information
LEVEL SAYS → closed 20.74, right under weekly line 21.32
BUSINESS SAYS → at $69 silver the fan starts near $100 — under 3x cash flow
I'M DOING → full runner. The level resolves the tension, not me.
Silver trades near $69. At that spot price, my fair-value fan for Hecla starts around $100. The stock trades at 20. Either the market refuses to believe this silver price will last — or something is deeply mispriced. I don't resolve that tension. I hold, and I let my 21.32 level decide.
Every position. Same honesty.
The three cases above are the flagships. Here is the rest of the book — updated every Sunday, all of it, in the same rhythm.
MY ENTRY → $155–170
LEVEL SAYS → 200.67 flipped · now 216.06 · next resistance 218.3–218.6, then 227.67
BUSINESS SAYS → fan at spot gold ~$174–350 · market pays ~10x — not stretched despite the run
I'M DOING → holding. My own trigger was 151; it's long gone.
MY ENTRY → 5 lots @ $58–63 · 4 lots added @ $71
LEVEL SAYS → 71.23 flipped to support · now 76.66 · my chart projects 99.21
BUSINESS SAYS → copper spot 6.587 sits just under my triggers 6.7150/6.8650 · fan ~$97–180
I'M DOING → holding the ladder: base in balance, added at the breakout.
MY ENTRY → ~3,320 GBX (3325 call, Jan '27)
LEVEL SAYS → 2,975 flipped · now 3,219 · strike in sight
BUSINESS SAYS → honest gap: no disclosed AISC yet — my model here is not robust, and I say so
I'M DOING → holding through the H1 earnings breakout (revenue +74.7%).
MY ENTRY → buy zone $15–16 — no long trigger yet
LEVEL SAYS → reversal off 13.57 · now 14.59 · trigger only above 14.95–15.06
BUSINESS SAYS → iron-ore fan at low diversified-miner multiples · copper/nickel not modeled
I'M DOING → watching, not forcing. The level invites me in — or it doesn't.
MY ENTRY → $45 (50 call, Mar '27)
LEVEL SAYS → now 46.19 · support 45.15 · targets 46.78 / 49.75 / strike 50
BUSINESS SAYS → dealer margins falling despite the gold rally — a live counterpoint I hold
I'M DOING → holding, eyes open. This one argues with my thesis every week.
MY ENTRY → Jan '27 calls (40/50 strikes) · position −40%
LEVEL SAYS → underlying ~29.96 · monthly structure intact per my journal · spike-retest expected
BUSINESS SAYS → not a metals play — no fan, no excuse
I'M DOING → holding, no adjustment. It stays on the table because honesty does.
What fits the thesis — and what doesn't
A few months and a handful of positions are evidence, not proof. Anyone selling you certainty from a sample this small is selling you a feeling.
"Anything can happen at any time —
and that's where freedom lies."
Why call it spiritual? Because the market is the most honest teacher I have found. It punishes attachment. It rewards presence. It humbles you exactly when you need it.
And it's the same with building a company. Growth there was never just revenue — a company is a living thing. The real growth is the people connected to it: growing with me, in skill and in consciousness, evolving as the whole evolves. Markets, companies, people — it's all one practice.
Week 1 through 11
The full map. Every Sunday. Free.
All levels, all fans, the honest ledger, and the invalidation lines — on Substack. Triggers arming? X first.
READ THE SUNDAY MAP → THE LIVE MAP →STEP 2: THE LIVE MAP · STEP 3: THE STORY WITH VOICE
I SHARE MY OWN TRADES AND MY OWN REASONING. NOTHING HERE IS INVESTMENT ADVICE OR A PROMISE OF RETURNS. I CAN BE WRONG — THAT'S PART OF THE PRACTICE.